. 2018 Nov 20;43(4):233–239. doi: 10.1584/jpestics.D18-008

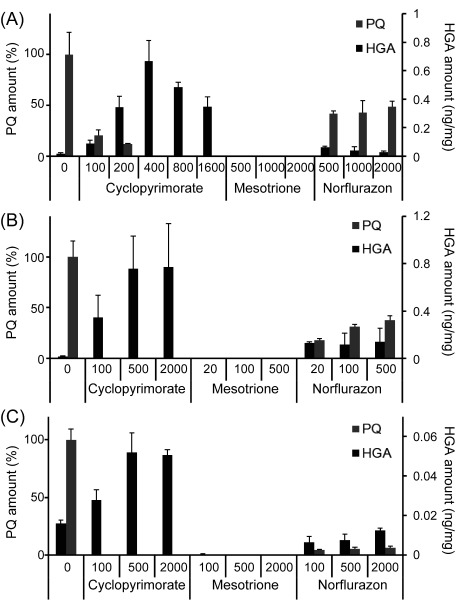
Fig. 4. The amount of plastoquinone (PQ) and homogentisate (HGA) in various plants 5 days after herbicide treatment. (A) A. thaliana seedlings, (B) B. juncea leaves, and (C) S. juncoides shoots. The concentration of each herbicide (ppm) is indicated along the X-axes. Data for PQ are normalized relative to the control, and data for HGA are expressed on a fresh weight basis. Values represent the mean±SD (n=3).

Fig. 4. The amount of plastoquinone (PQ) and homogentisate (HGA) in various plants 5 days after herbicide treatment. (A) A. thaliana seedlings, (B) B. juncea leaves, and (C) S. juncoides shoots. The concentration of each herbicide (ppm) is indicated along the X-axes. Data for PQ are normalized relative to the control, and data for HGA are expressed on a fresh weight basis. Values represent the mean±SD (n=3).