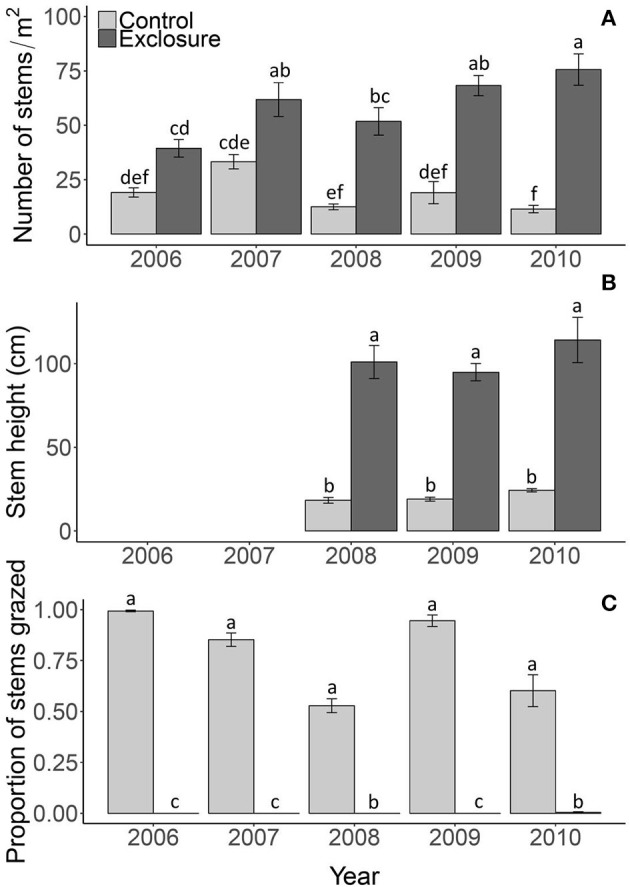
Figure 2.

Reed density (A), stem height above the water (B) and proportion of stems grazed (C) in the control plots and exclosures. Data are means ± SE, n = 6. Different letters indicate significant differences among the control and exclosure treatments and years at P < 0.05.
