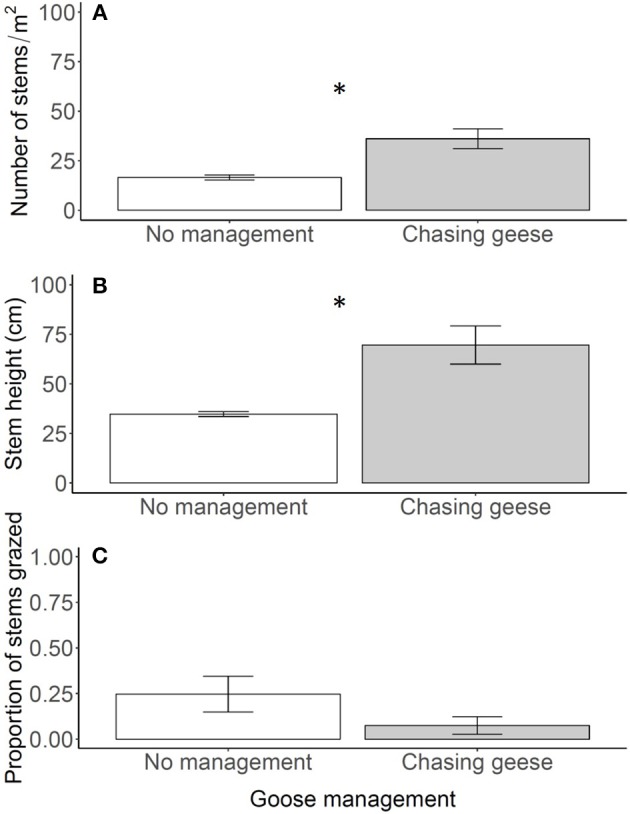
Figure 4.

Reed density (A), stem height above the water (B) and proportion of grazed stems (C) in the control plots in 2012 (no management) and 2013 (chasing geese). In 2013 geese were actively chased away, whereas they could forage undisturbed in 2012. Data are means ± SE, n = 6. An asterisk indicates a significant difference between years at P < 0.05.
