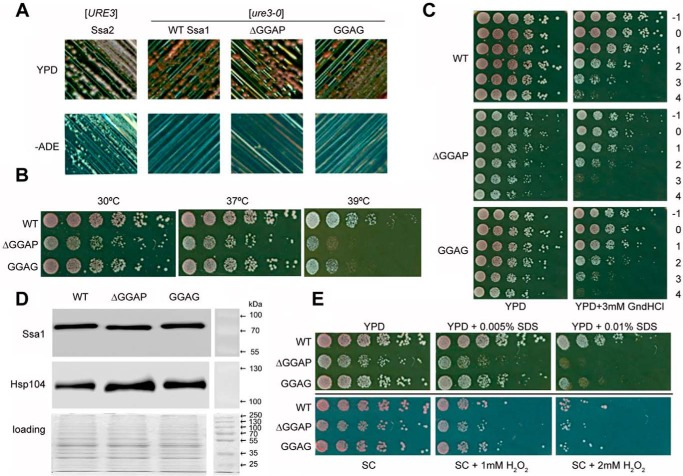
Figure 5.
Effects of Ssa1 ΔGGAP and GGAG mutations in S. cerevisiae [URE3] strain under different conditions. A, assessment of [URE3] propagation. Single colonies containing Ssa2, WT Ssa1, ΔGGAP, or GGAG mutant Ssa1 as the sole source of Ssa were streaked on YPD and −ADE plates, which were then incubated at 30 °C for 2 days. Red colonies on YPD and nonviability to grow on −ADE plates indicate a [ure3-0] state; white colonies on YPD and viability on −ADE plates indicate a [URE3] state. B, growth assay at elevated temperatures. Fresh cultures were spotted onto YPD after a one-fifth serial dilution. The plates were incubated at 30, 37, or 39 °C for 2 days. C, acquired thermotolerance assay of ΔGGAP and GGAG mutations. Yeast cells were cultured at 30 °C to reach an A600 of 0.4 before pretreating at 39 °C for 1 h. Then 39 °C pretreated cells were heat-shocked at 47 °C for a time course. −1, cultures without 39 °C incubation; 0–4, cultures were first incubated 39 °C for 1 h and then moved to 47 °C incubator for 0, 10, 20, 30, or 40 min. D, expression levels of Ssa1 and Hsp104. The experiment was repeated three times, consistently showing that the mutant Ssa1 proteins are expressed at a similar level to WT and that slightly more Hsp104 is expressed in cells with GGAP deletion or substitution. E, assessment of ΔGGAP and GGAG mutations under cell-wall damage reagent SDS and oxidative damage reagent H2O2.

