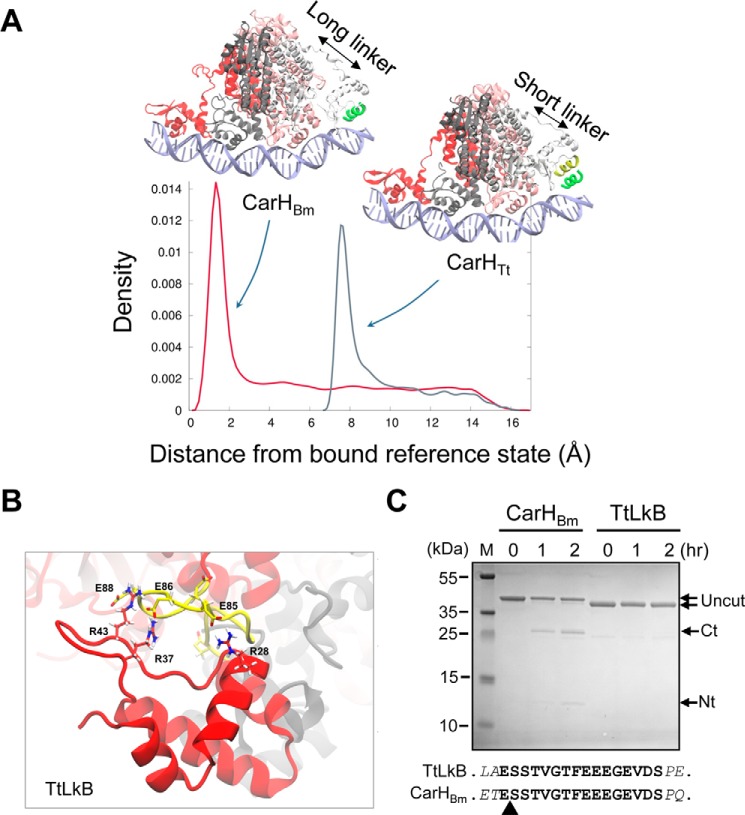
Figure 7.
Linker effects on CarHBm, CarHTt, and TtLkB. A, density plots showing the probability to find the fourth DBD in the configurational space between 0 and 15 Å of root mean square deviation relative to the reference bound state defined by the DNA recognition helix (green) for CarHTt and CarHBm, as indicated. B, snapshot of the last 50 ns of the 500-ns MD simulation of TtLkB showing H-bond interactions formed between the DBD Arg residues (red) and the Glu residues in the interdomain linker (yellow), as indicated. C, CarHBm and TtLkB digested with Glu-C at the times (in hours) indicated. The uncut protein (TtLkB, 34.3 kDa; CarHBm, 36.3 kDa) and the GluC cleavage products (Ct corresponds to the C-terminal domain of CarHBm (∼25 kDa) and Nt to the His-tagged N-terminal domain (∼12 kDa)); M, size markers. The sequence of the CarHBm linker (boldface) with the two flanking residues (italics) in CarHBm and TtLkB is shown below; the arrowhead points to the GluC-cleavage site in the linker in CarHBm identified by N-terminal sequencing.

