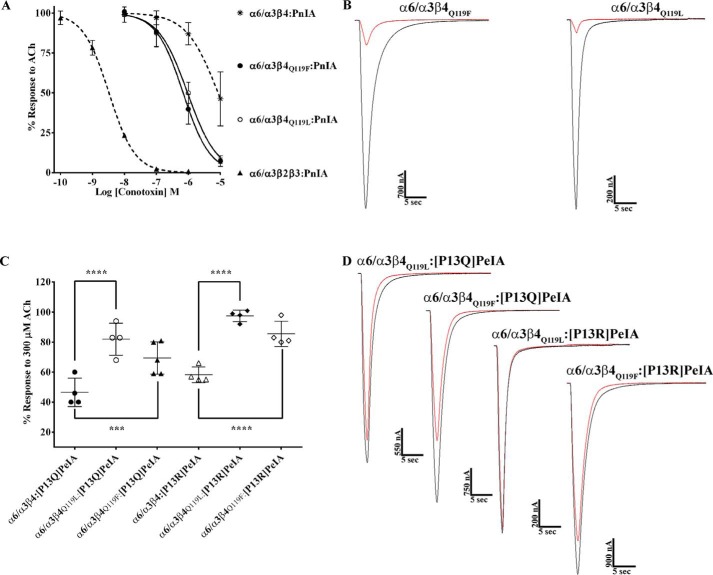
Figure 11.
Structure–activity studies of PnIA and PeIA demonstrate interaction between position 119 of rat β4 and α-Ctxs. X. laevis oocytes expressing rat nAChRs were subjected to TEVC electrophysiology as described under “Experimental procedures,” and the IC50 values were determined for inhibition of ACh-evoked currents by α-Ctxs. A, concentration–response curves for inhibition of α6/α3β4Q119L and α6/α3β4Q119F mutant nAChRs by PnIA. The IC50 values are provided in Table 7. Error bars, S.D. from at least four individual oocytes for each IC50 determination. Dashed lines, data previously presented for PnIA on rat α6/α3β2β3 and α6/α3β4 nAChRs and shown for ease of visual comparison. B, representative current traces showing inhibition of α6/α3β4Q119F and α6/α3β4Q119L by 10 μm PnIA. Traces in black are control responses, and those in red are responses in the presence of PnIA. C, response analysis of [P13Q]PeIA and [P13R]PeIA inhibition of ACh-evoked currents mediated by mutant α6/α3β4Q119L and α6/α3β4Q119F nAChRs. The currents mediated by α6/α3β4Q119L and α6/α3β4Q119F nAChRs in the presence of 10 μm [P13Q]PeIA were 82 ± 5% (n = 4) and 69 ± 5% (n = 5), respectively, of control responses and were significantly larger than those obtained for α6/α3β4 nAChRs (47 ± 5% (n = 4)). The responses of α6/α3β4Q119L and α6/α3β4Q119F nAChRs after exposure to 10 μm [P13R]PeIA were also significantly larger than those obtained with α6/α3β4 nAChRs under the same conditions (98 ± 2% (n = 4) and 86 ± 4% (n = 4), respectively, of control responses compared with 58 ± 3% (n = 4) for α6/α3β4 nAChRs). Statistical significance was determined using an analysis of variance and Fisher's least significant difference test (***, p ≤ 0.001; ****, p ≤ 0.0001). Error bars, S.D. for the indicated number of individual replicates. D, representative current traces for inhibition of mutant α6/α3β4Q119L and α6/α3β4Q119F nAChRs by the indicated PeIA analogs. Traces in black are control responses, and those in red are responses in the presence of the α-Ctxs.

