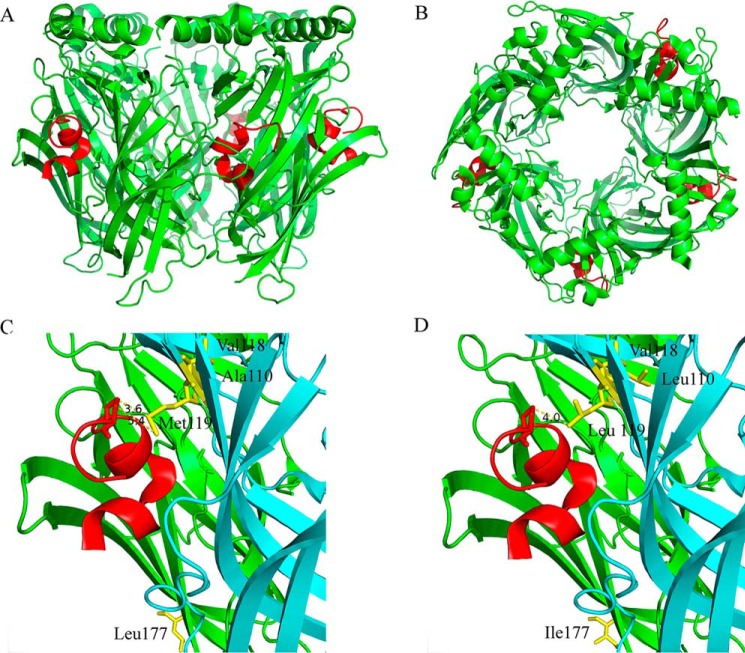
Figure 6.
X-ray crystallography of PeIA complexed with the A. californica AChBP. A and B, cartoon rendition of the AChBP–PeIA structure shown from the side (A) and from the top or extracellular view (B). The AChBP is shown in green, and PeIA is shown in red. Residues 1–10 of PeIA are recognized as forming two α-helices split between residues His5 and Pro6. An electron density for a fifth PeIA molecule was observed but omitted because the clarity of the electron density was such that only the peptide backbone structure could be determined accurately, not the side-chain positions. C, cartoon rendition of two subunits showing the location of residues Ala110, Val118, and Met119 (yellow) in the complementary (−) subunit (cyan) and Leu177 (yellow) of the principal subunit (green). Note that the side chain of Met119 is oriented toward PeIA, whereas the side chains of Ala110 and Val118 are oriented away from PeIA. Pro13 of PeIA is depicted as a stick model. The distances between the γ-carbon of PeIA Pro13 and the δ-sulfur and ϵ-carbon of Met119 were 3.6 and 5.4 Å, respectively. D, cartoon rendition of the AChBP–PeIA structure with positions 177 of the principal (+) subunit and 110, 118, and 119 of the complementary (−) subunit mutated to the residues found in the homologous positions of human α6 and β4 subunits, respectively. The distance between the γ-carbon of PeIA Pro13 and the γ-carbon of Leu119 of the complementary subunit was 4.0 Å. Note that position 177 is located outside the ligand-binding pocket and therefore unlikely to directly interact with PeIA.

