Figure 1.
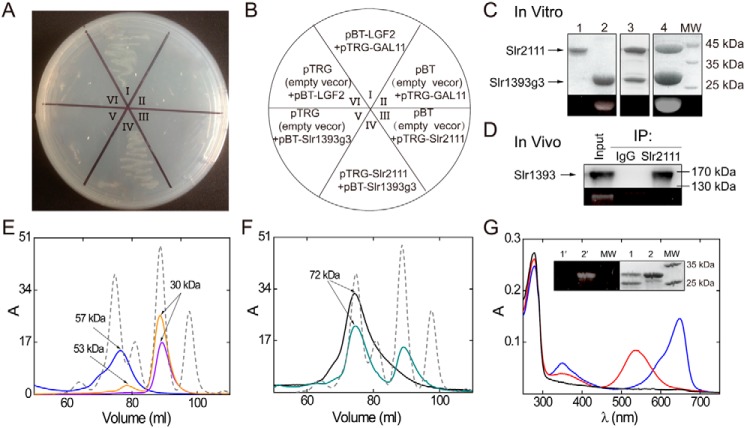
Protein interaction of Slr2111 and Slr1393g3. A, protein interaction demonstrated by the BacterioMatch II Two-hybrid System. The reporter strain containing pBT-Slr1393g3 + pTRG-Slr2111 (A, IV) grew well in the presence of 3-AT and streptomycin. B, the wheel shows the details of the plate of A. The reporter strains II, VI, III, and V acted as negative controls, and I acted as the positive control. C, SDS-PAGE control of pulldown assay results; lane 1, elution fractions of GST-Slr2111 (43 kDa); lane 2, PCB-His6tag-Slr1393g3 (24 kDa); lane 3, elution fraction of PCB-His6tag-Slr1393g3 and GST-Slr2111 on GST affinity chromatography; lane 4, elution fraction of PCB-His6tag-Slr1393g3 and GST-Slr2111 on His6-tag affinity column. The bottom panel shows the Zn2+-induced fluorescence of the chromoprotein band on SDS-PAGE. D, co-immunoprecipitations of Slr1393 and Slr2111. Input: lysate from Synechocystis. Slr2111 antibodies were bound to protein A beads and used for immunoprecipitation from total Synechocystis sp. PCC 6803 soluble proteins. Immunoprecipitates with anti-Slr2111 antibodies or control immunoglobulin G (IgG) was assayed with SDS-PAGE without reducing agent and then Western blotted with anti-Slr1393. The bottom panel shows the Zn2+-induced fluorescence of the chromoprotein band on SDS-PAGE. E, gel filtration chromatography profiles of His6tag-Slr2111 (blue line), PCB-His6tag-Slr1393g3 (orange line), His6tag-Slr1393g3 (violet line), using a Superdex 200 column; elution buffer: KPB (20 mm, pH 7.4) containing NaCl (200 mm) (see “Materials and methods”). Blue line, peak corresponds to Slr2111 as dimer (57 kDa, calculated 45 kDa). Violet line, peak corresponds to Slr1393g3 as monomer (30 kDa, calculated 24 kDa). Orange line, two peaks correspond to PCB-Slr1393g3 as monomer (30 kDa, calculated 24 kDa) and dimer (53 kDa, calculated 48 kDa), respectively. Molecular markers (peaks from left to right of gray dashed line) were 66, 45, 29, and 12.4 kDa; F, the complex of Slr2111 and Slr1393g3 in a 1:1 ratio elutes with an apparent mass of 72 kDa (black line), and the mixture of Slr2111 and PCB-Slr1393g3 in a 1:1 ratio elutes with the respective apparent mass of 72 and 30 kDa (green line) under the same experimental conditions as in E. Gel chromatography identifies the complex of Slr2111 and Slr1393g3 as a mixture of heterodimer (72 kDa, calculated 47 kDa) and heterotetramer (72 kDa, calculated 94 kDa). G, absorption spectrum (black line) of the early peak of the green line in F purified by gel chromatography, absorption after irradiation with 530 nm (Z state, blue line), and 650-nm light (E state, red line) of the later peak of the green line in F were measured. Inset G, SDS-PAGE of the early peak (lane 1) and later peak (lane 2) of the green line in F; left panel 1′ and 2′ show the Zn2+-induced fluorescence of the chromoprotein band on SDS-PAGE.

