Figure 2.
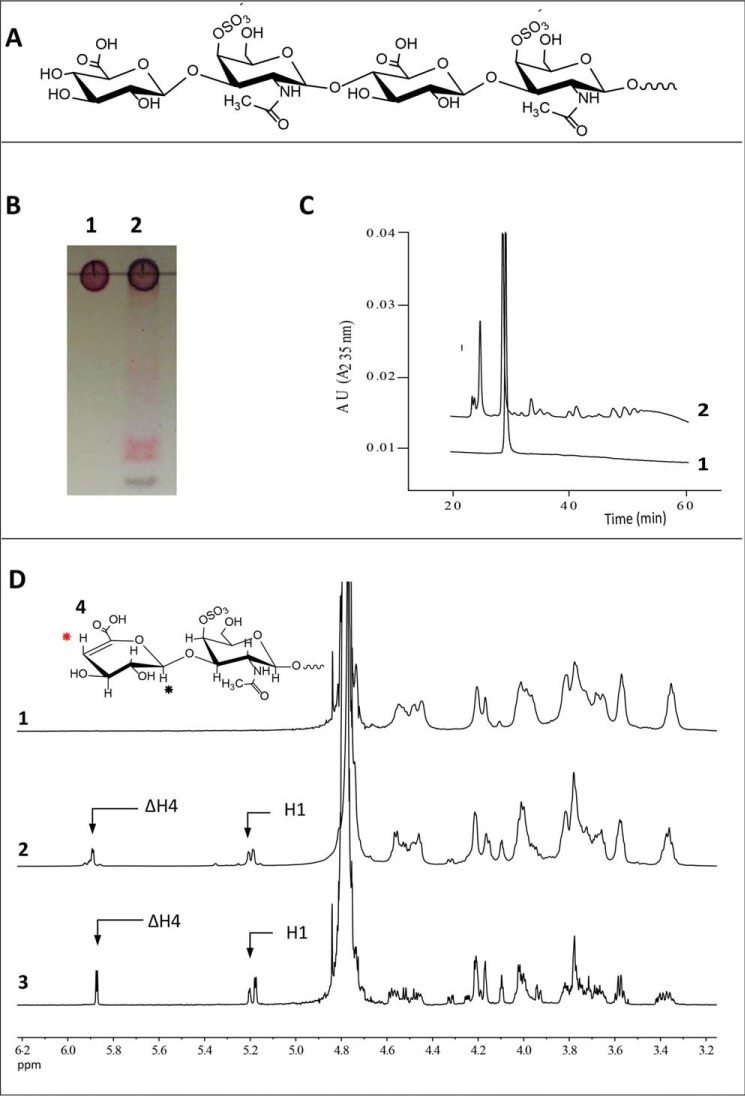
Analyses of chondroitin 4-sulfate (CSA) degradation by BtCDH lyase. A, chemical structure of intact CSA. B, TLC of CSA before and after digestion by BtCDH lyase. For the reaction, 13.3 mg/ml of CSA from bovine trachea was treated with 0.3 μm of BtCDH lyase overnight. The reaction was stopped by boiling and 53.4 μg of digested CSA analyzed by TLC. Lane 1, CSA; lane 2, CSA treated with BtCDH lyase. C, HPAEC chromatogram of CSA digestion. Half the amount (26.7 μg) of sample in A was analyzed by HPAEC. D, 1H NMR results of CSA digestion by BtCDH lyase. Digested CSA products were purified by SEC and later analyzed by NMR. Panel 1, NMR spectrum of undigested CSA. Panel 2, spectra of species from all SEC fractions combined (fractions 1–43 in Fig. S1). Panel 3, spectra of species from selected homogenous fractions (pooled fractions 37–39 in in Fig. S1). Both spectra show resonance peaks for H1 and H4 (black and red) at 5.1 and 5.9 ppm, respectively, consistent with the formation of terminal unsaturated CSA oligosaccharides. Panel 4 (inset), a typical chemical rearrangement of components of the nonreducing end sugar in CSA after lyase digestion. H4 and H1 are marked with red and black circles, respectively.

