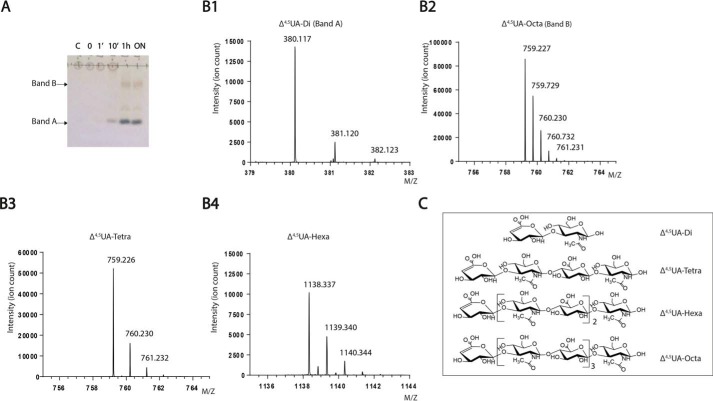
Figure 3.
Evidence of BtCDH endo-lyase activity. A, TLC showing progressive degradation of hyaluronanic acid (HAL, 10–20 kDa) by BtCDH lyase over time. For the reaction, 32 mg/ml of HAL was digested with 2 μm of enzyme. The reaction was stopped at the various time points indicated, and 64 μg of each sample was analyzed by TLC. B, mass spectrometry data of purified HAL oligosaccharide species. Panel 1, spectrum for Δ4,5UA-disaccharide (Δ4,5UA-Di or band A). Panel 2, spectrum for Δ4,5UA-octasaccharide (Δ4,5UA-Octa or band B). Panel 3, spectrum for Δ4,5UA-tetrasaccharide (Δ4,5UA-Tetra). Panel 4, spectrum for Δ4,5UA-hexasaccharide (Δ4,5UA-Hexa). C, structural representation of various species detected in B.

