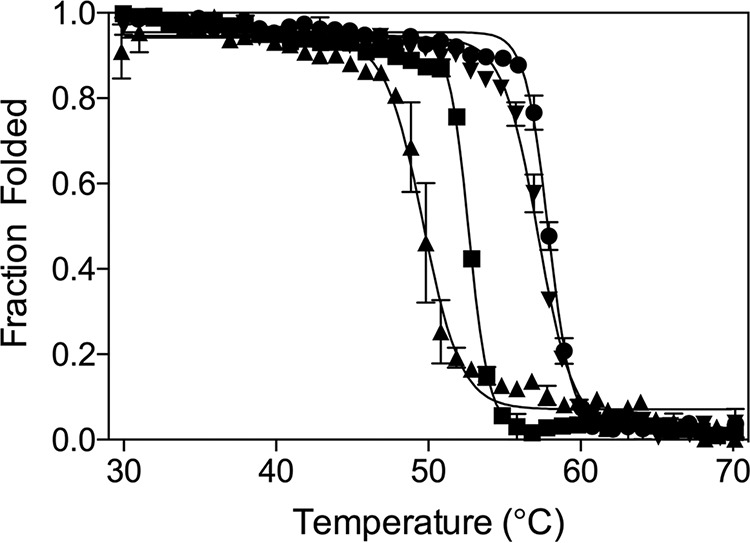
Figure 2.

Thermal denaturation curves for CTX-M-14 (WT) and mutant enzymes. The melting curves are shown for the WT CTX-M-14 (square symbol), D240G (upward triangle), N106S (circle), and N106S/D240G (downward triangle) mutant enzymes. The Tm values (Table 3) were determined by fitting a sigmoidal function to the transition from the folded to unfolded state (see “Experimental procedures”).
