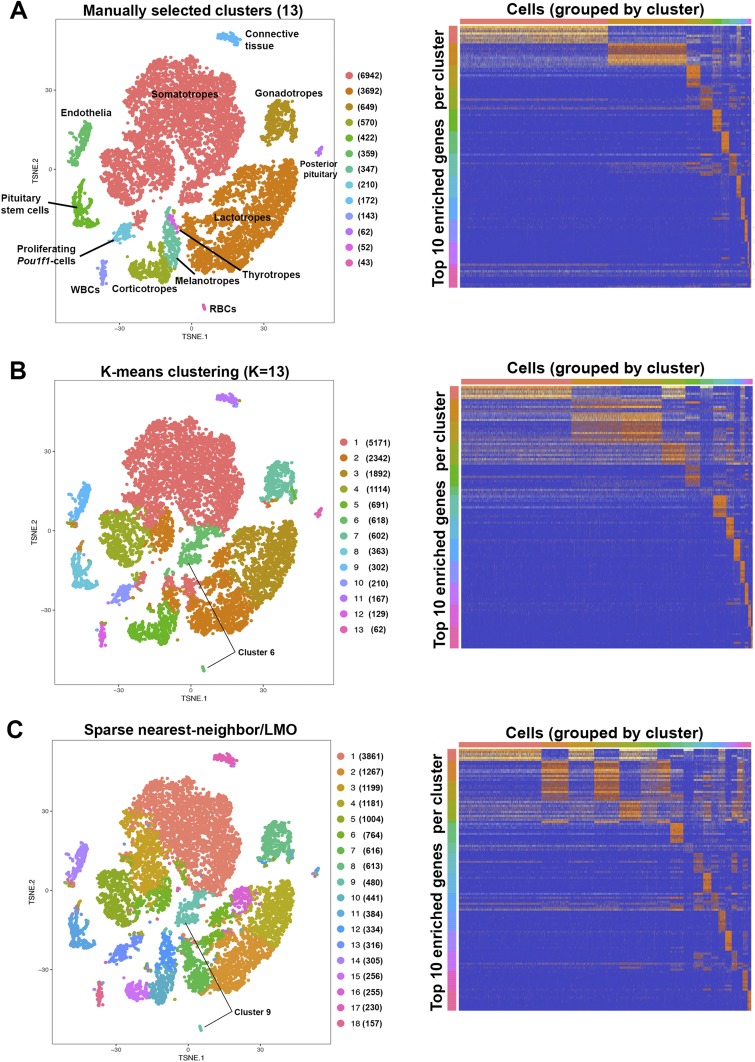
Figure 4.
Cluster analyses of pituitary hormone-producing cells and other cell types. Numbers in parentheses beside each cluster label indicate number of cells in that cluster. (A) Manual assignment of cells to expected cell types based on gene expression of known markers. The gene expression heat map shows the distinct patterns for each cell cluster. (B) Traditional K-means clustering for 13 populations finds subpopulations within Gh- and Prl-expressing populations, but does not distinguish thyrotropes, melanotropes, or red blood cells as separate populations. (C) Cell clustering by the graph-based sparse nearest neighbor and Louvain modularity optimization method generates 18 cell clusters, identifying subpopulations within Gh- and Prl-expressing populations, but does not distinguish Tshb-, Pax7-, or hemoglobin-expressing cells as separate populations.

