
Figure 6.
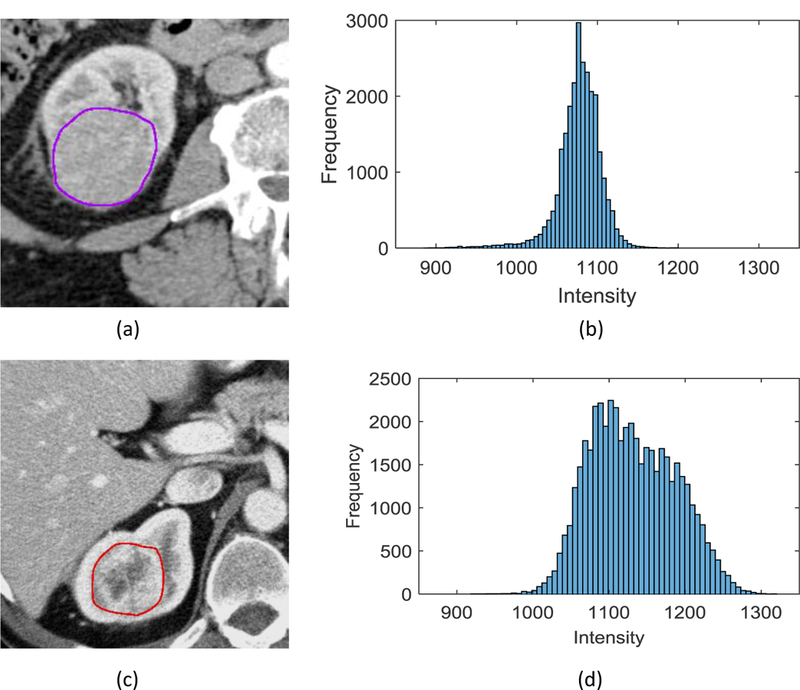
Kurtosis in tumor CT images. (a) A tumor without VHL mutation, (b) Histogram, with kurtosis= 26.57 (Z-score= 1.92), (c) A tumor with VHL mutation, (d) Histogram with kurtosis= 7.17 (Z-score= −1.33).
Official websites use .gov
A
.gov website belongs to an official
government organization in the United States.
Secure .gov websites use HTTPS
A lock (
) or https:// means you've safely
connected to the .gov website. Share sensitive
information only on official, secure websites.
Kurtosis in tumor CT images. (a) A tumor without VHL mutation, (b) Histogram, with kurtosis= 26.57 (Z-score= 1.92), (c) A tumor with VHL mutation, (d) Histogram with kurtosis= 7.17 (Z-score= −1.33).