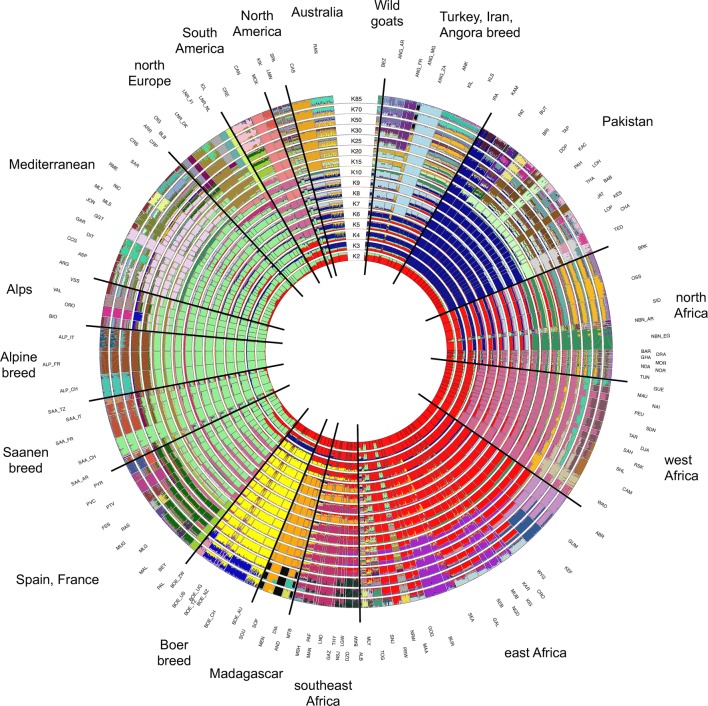
Fig. 6.
Worldwide population structure of goat breeds included in the AdaptMap project. Circular representation of Admixture software results for K = 2–10, 15, 20, 25, 30, 50, 70 and 85 (lowest cross-validation error value). To increase readability, the country codes are omitted from the population labels, with the exception of breeds sampled in multiple countries

