Fig. 4.
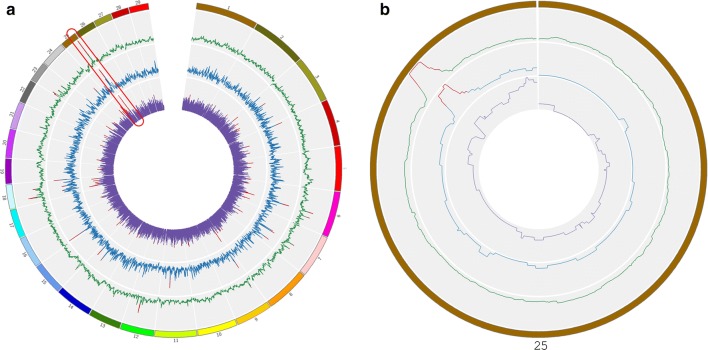
ROH, FST and XP-EHH for fiber (a), and detail of the ROH analyses on chromosome 25 for the breeds that compose the group of “fiber-producing” goat breeds: Angora, Ankara and Cashmere (b). (a) The three analyses are shown with different plot colors, within the most external squared-based circle, where each color represent a chromosome (chromosome number outside the squares): green (external) = ROH; blue (middle) = FST; violet (internal): XP-EHH. For the three analyses, the regions above the threshold are marked in red. The region of high homozygosity (chromosome 25: 35,240,726-36,394,939 bp) is highlighted in red. (b) The three different breeds are labelled with different colors: green (external) = Angora; blue (middle) = Ankara; violet (internal): Cashmere. For the three breeds, the part corresponding to the 35-36 Mb region is marked in red when above the threshold

