
Figure 2.
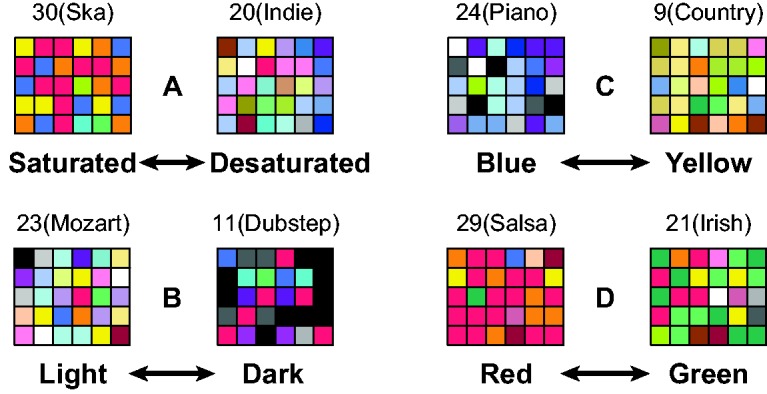
Example of the “best fitting” colors from the cross-modal music-to-color association task. The examples shown represent relatively extreme values for each of the four color–appearance dimensions (red/green, yellow/blue, light/dark, and saturated/desaturated) with relatively similar values for the other three dimensions. Labels above the array identify the genre name of the musical excerpts represented.