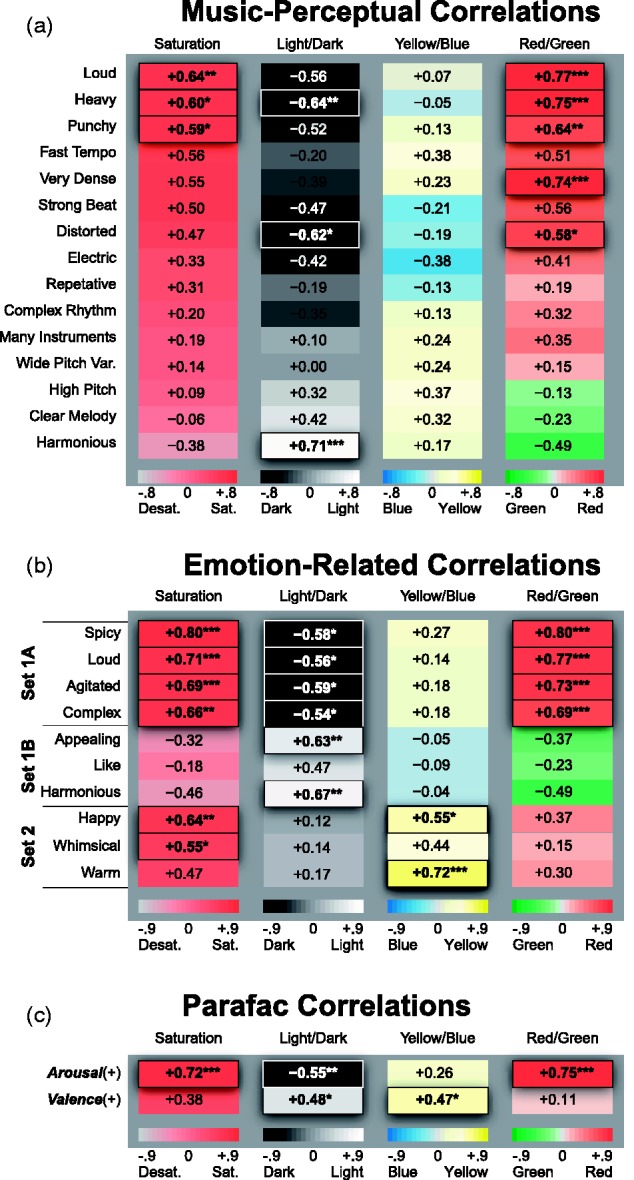
Figure 3.

(a) Correlations between the 15 music–perceptual features and the weighted average color–appearance values of the colors picked as going best/worst with the music (the Perceptual-MCAs). (b) Correlations between the 10 music–emotion ratings and the weighted average color–appearance values of the colors picked to go with the music. The grouping of emotion-related features into Sets 1A, 1B, and 2 is explained in the subsection “Results of Higher Level Emotional Correlations in Music-to-Color Associations.” (c) Same correlations as in (b) for the two latent emotion factors identified by Parafac (arousal and valence). Family-wise error rate was controlled using Holm's method. Significant correlations are denoted with asterisks (***p < .001, **p < .01, and *p < .05) and by raised outlined borders.
