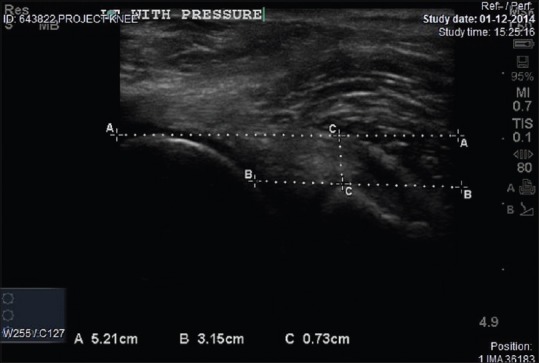
Figure 7.

Sonograph of left knee pressure. After giving pressure, on the tibial condyle, line A is a tangent drawn from the highest point of femoral condyle. Line B is a tangent drawn from the highest point of the tibial condyle. CC is the distance between femoral and tibial condyle, also denotes the translation on pressure
