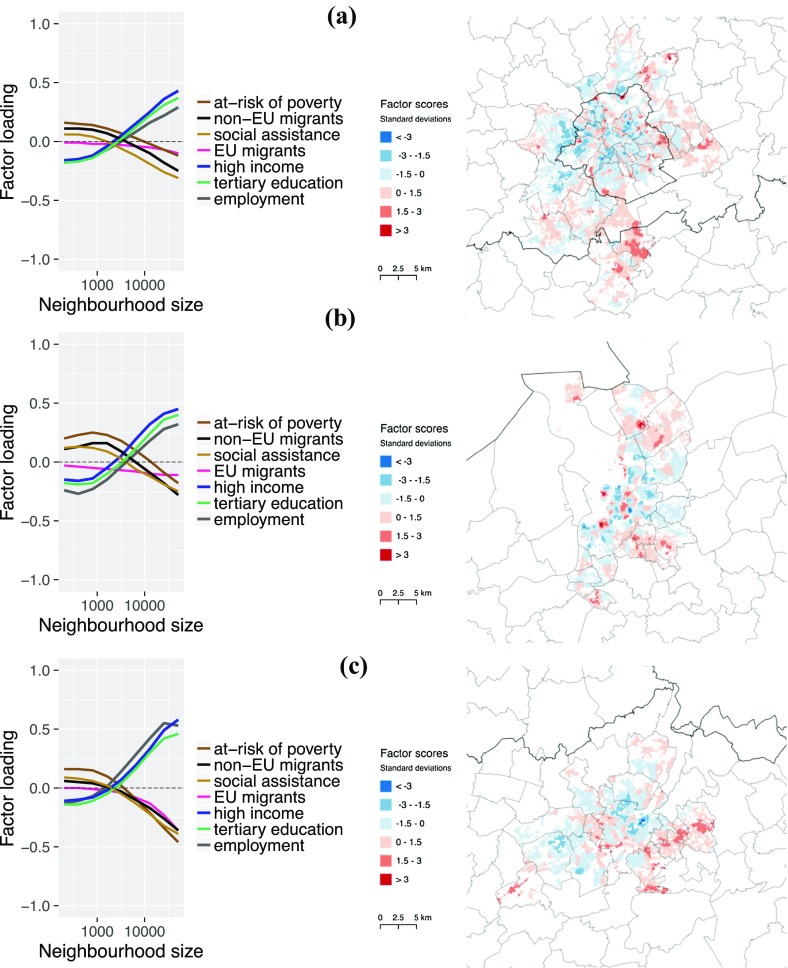
Fig. 4.
‘Enclaves’ factor: local segregation, scale-dependent. a Brussels. b Antwerp. c Liege. Note The graphs on the left represent indicators’ loadings on the factor as a function of scale (i.e. number of nearest neighbours); they provide a synthetic view of the factor in respect to its socioeconomic features as the scale varies. The maps on the right side depict the spatial distribution of grids’ factor scores in the three cities. In particular, they allow the location of spots with extreme values, where the factors’ features are most pronounced.
Source: Census 2011 data; authors calculations

