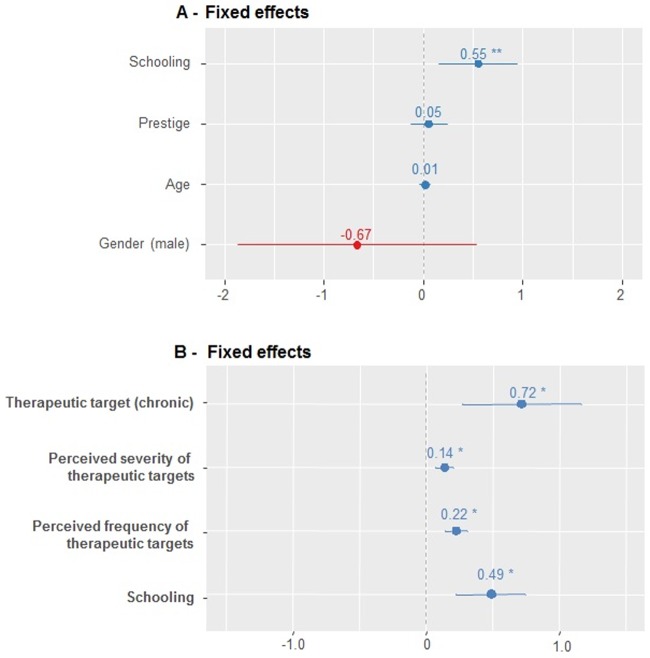
Fig 2. Fixed effect coefficients graph of the models 6 and 11.
A- Model 6, which represents the insertion of socioeconomic variables to explain the overlapping use of modern medicine and medicinal plants; B- Model 11, which represents the insertion of socioeconomic and functional variables with a better fit to explain the overlapping use of treatments in the Carão community, Northeast Brazil. * p <0.05.

