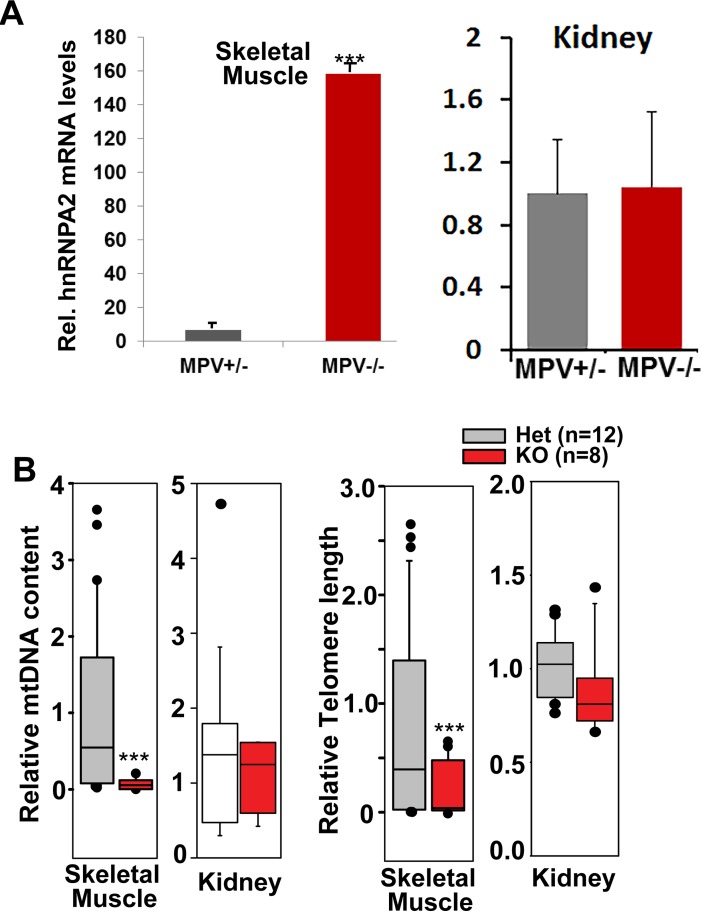
Fig 2. MtDNA depletion induced telomere shortening in vivo.
(A) Real time PCR showing mRNA levels of hnRNPA2 in skeletal muscle and kidney tissues in MPV +/- and MPV-/- mice; n = 12 for MPV +/- and n = 8 for MPV-/- mice. (B) Box plots of telomere length and mtDNA content for skeletal muscle and kidney tissues of MPV17 +/-and MPV-/- mice; n = 12 for MPV+/-, n = 8 for MPV-/- mice. The line within each box represents the median. Data are represented as mean ± SD.

