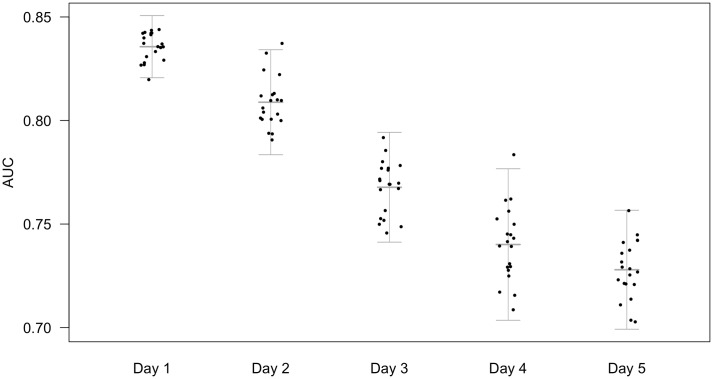
Fig 2. AUC of APACHE-II when applied to patients remaining in ICU on days 1-5.
Area under the receiver operating characteristic curve (AUC) from logistic regression models built applying admission (24 hour) APACHE-II for only the patients remaining on each subsequent day, predicting vital status at discharge on twenty cross-folded validation sets. Points represent the mean AUC for each fold across nine imputations. Bars represent the mean of twenty folds +/- 2 standard deviations, calculated from the combined variance of folding and imputation. The predictive performance of admission APACHE-II declines when applied to predict outcome on subsequent days.

