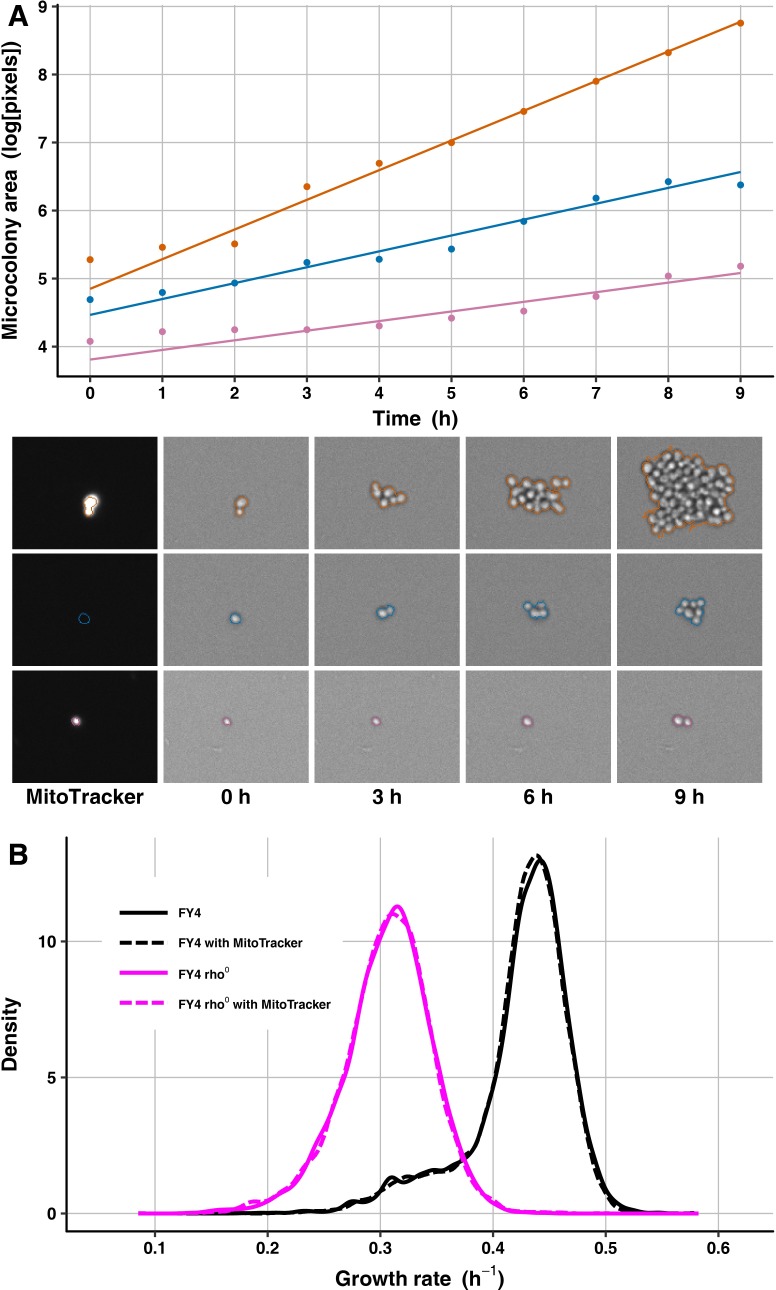
Fig 2. MitoTracker staining does not affect growth-rate distributions of wild-type or petite cell populations.
(A) Microcolony areas were tracked through time to estimate growth rates, and MitoTracker staining was recorded at the first time point to identify petite cells. The changes in microcolony area over time are plotted for three FY4 microcolonies: a fast-growing colony (orange), a petite colony (blue), and a slow-growing non-petite colony (light purple). Solid lines are best-fit growth trajectories estimated as previously [6, 134]. Images below the plot show the corresponding microcolonies’ MitoTracker staining (left) and areas at several time points, with computed microcolony outlines indicated in the corresponding colors. (B) Shown is a density plot of microcolony growth rates for FY4 (black) and an FY4-derived rho0 petite strain (magenta) with (dashed line) and without (solid line) MitoTracker staining. Microcolony sample sizes: 6787 for FY4 without MitoTracker, 6966 for FY4 with MitoTracker, 6998 for petite without MitoTracker, 6883 for petite with MitoTracker.

