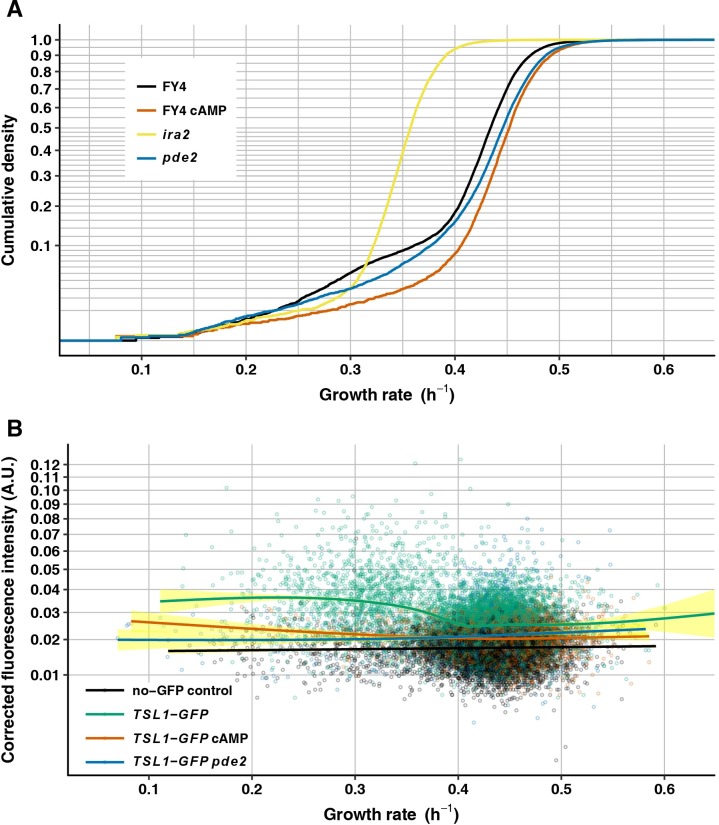
Fig 4. Intracellular cAMP controls nongenetic heterogeneity.
(A) Growth-rate cumulative density curves of FY4 (black, 11900 microcolonies), FY4 cultivated with 15 mM 8-bromo-cAMP (orange, 4510 microcolonies), ira2 (yellow, 6495 microcolonies) and pde2 (blue, 8666 microcolonies). Vertical axis is on a square-root scale for a better view of the slower-growing tail of each distribution. (B) Mean GFP fluorescence intensity—corrected by subtracting local background fluorescence then by subtracting the minimum value for the entire experiment, to avoid negative values (see Methods, vertical axis)—is plotted against microcolony growth rate (horizontal axis) for FY4 no-GFP control (black, 7340 microcolonies), TSL1-GFP (green, 6912 microcolonies), TSL1-GFP cultivated with 15 mM 8-bromo-cAMP (orange, 3730 microcolonies) and TSL1-GFP pde2 (blue, 1778 microcolonies). Each solid line is the fit to a generalized additive model with cubic spline smoother, with 95% confidence interval shown in yellow. Vertical axis is on a square-root scale for a better view at the low-intensity end.

