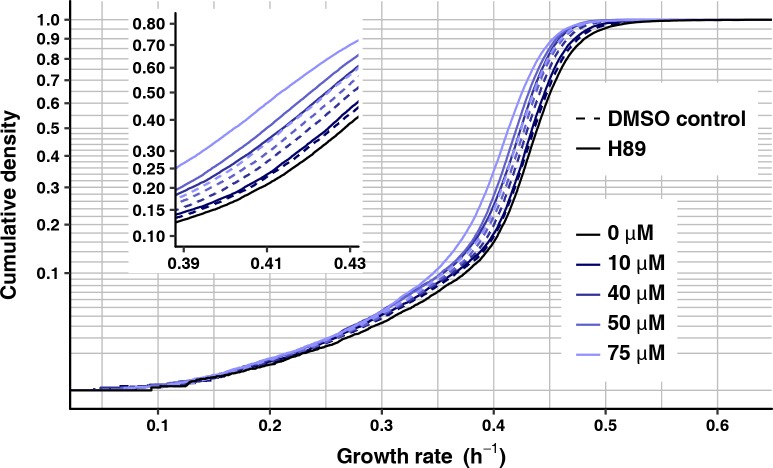
Fig 7. Treatment with PKA inhibitor H89 reduces growth rate.
Growth-rate cumulative density curves of FY4 without H89 treatment (solid, black line, 16720 microcolonies) or treated with 10 μM (17612 microcolonies), 40 μM (19498 microcolonies), 50 μM (19528 microcolonies) and 75 μM H89 (20505 microcolonies) (solid lines of increasingly light shades of blue) and matched DMSO controls (10 μM, 16559 microcolonies; 40 μM, 19334 microcolonies; 50 μM, 18869 microcolonies; and 75 μM H89, 19551 microcolonies) (dashed lines). The inset plot shows the same data, zoomed into the growth-rate range between 0.39 and 0.43. Vertical axes are on a square-root scale for a better view of the slower-growing tail of each distribution.

