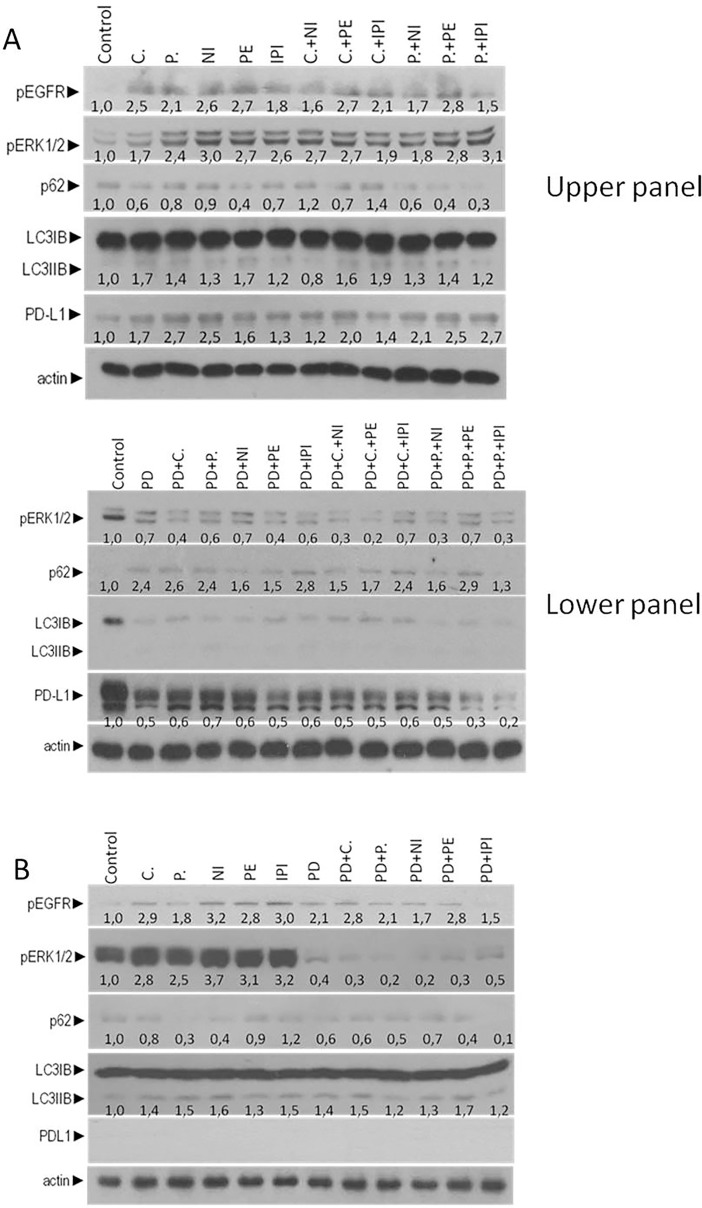
Fig 7. ERK-depended of autophagy induction in MSI-H and BRAFV600E cell lines after treatment with checkpoint inhibitors or anti-EGFR mAbs.
(A) Western blot analysis of protein levels of pEGFR, pERKs, LC3, p62, PD-L1 and actin after 24 hours treatment with 1μM anti-EGFR mAbs Cetuximab or panitumumab and 0,5 μM checkpoint inhibitors nivolumab, pembrolizumab or ipilimumab and the combination of E+I in mutant BRAFV600E cell line RKO (upper panel) and in PD, PD+E (PD+C, PD+P), PD+I (PD+NI, PD+PE, PD+IPI) (lower panel). The quantification of LC3 reflects the ratio of LC3II/LC3I in comparison with control in each sample separately. (B) Western blot analysis of protein levels of pEGFR, pERKs, LC3, p62, PD-L1 and actin after treatment for 24 hours treatment with 1μM anti-EGFR mAbs Cetuximab or panitumumab and 0,5 μM checkpoint inhibitors nivolumab, pembrolizumab or ipilimumab, 1μM of MEK inhibitor PD 0325901 and in PD+E (PD+C, PD+P), PD+I (PD+NI, PD+PE, PD+IPI) in colo-205 cell line for 24 hours. The quantification of LC3 reflects the ratio of LC3II/LC3I in comparison with control in each sample separately.

