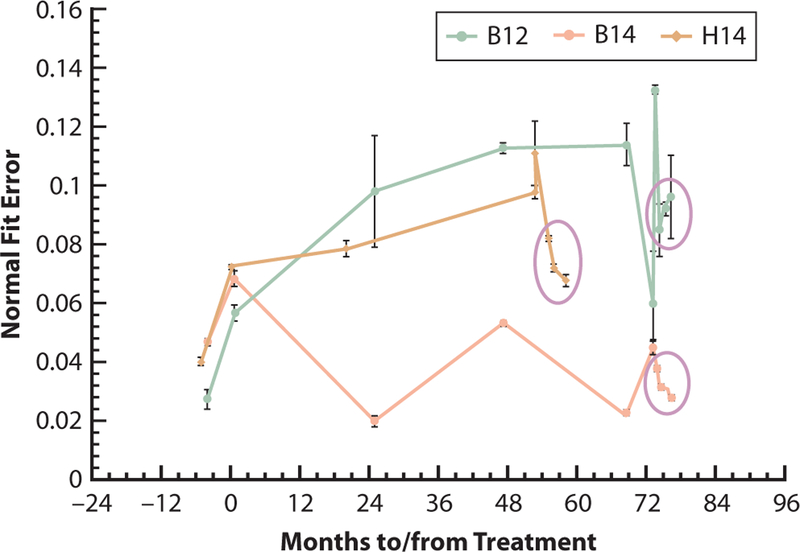
Figure 8.
Chart showing sites B12, B14, and H14 monitoring results. Circles show 3 NFE tests after occlusal adjustments and preventive counseling for each site. Site B12 dropped significantly at first but then slowly increased as patient’s health problems lingered. Site B14 and H14 continued to exhibit lower NFE levels with greater protection. NFE, normal fit error; QPD, quantitative percussion diagnostics.

