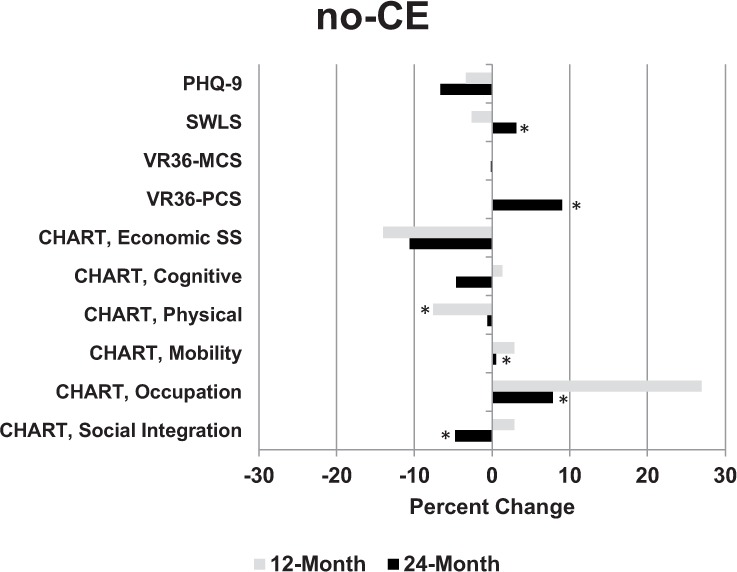
Figure 2.

Changes in measures over time in the no-competitive employment (no-CE) group. Higher values for CHART, VR36, and SWLS indicate improvement; lower values for PHQ-9 indicate improvement. CHART = Craig Handicap and Reporting Technique; MCS = mental component scale; PCS = physical component scale; PHQ-9 = Patient Health Questionnaire; SWLS = Satisfaction with Life Scale; VR36 = Veterans RAND 36-item health survey. *p ≤ .05.
