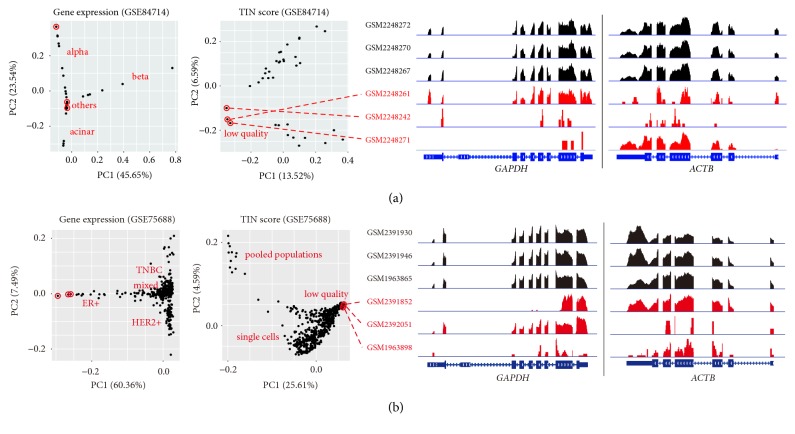
Figure 4.
Systematic assessment of RNA-seq data. (a) PCA plots show the characteristics of islet single cell RNA-seq data (n = 36) treated with Artemether (GSE84714) using gene expression levels and RNA qualities. (b) PCA plots unveil the characteristics of breast cancer RNA-seq data (n = 563, 549 single cells and 14 bulk tumor cells) from 11 patients (GSE75688). IGV snapshots show the patterns of mapped reads on the GAPDH and ACTB genes (right panel). The proportion of variance explained is indicated in parentheses.

