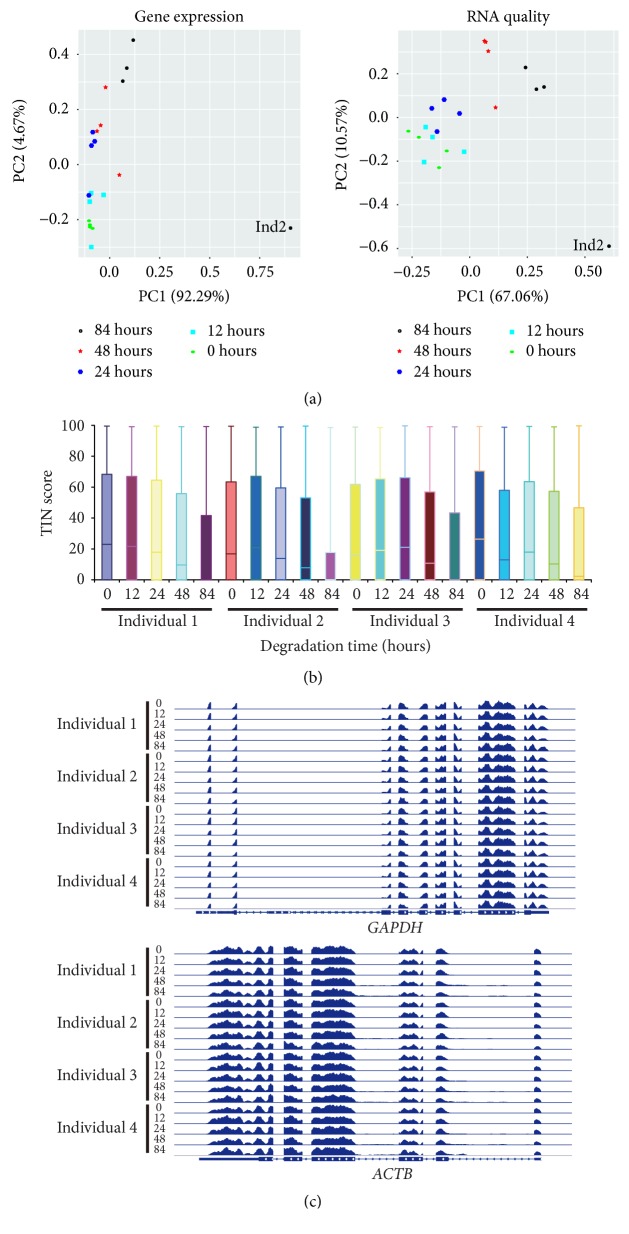
Figure 5.
Systematic evaluation of an available RNA-seq dataset. (a) PCA plots of RNA-seq data (n = 20) show the characteristics of peripheral blood mononuclear cell (PBMC) samples that were stored unprocessed at room temperature for different time periods (0, 12, 24, 48, and 84 hours). Each dot indicates a sample. The proportion of variance explained is indicated in parentheses. (b) Boxplot indicates the RNA quality of samples according to the TIN scores. A thick line (black) within the box marks the mean. (c) Genome browser snapshots of mapped read densities are shown using integrative genomics viewer (IGV).

