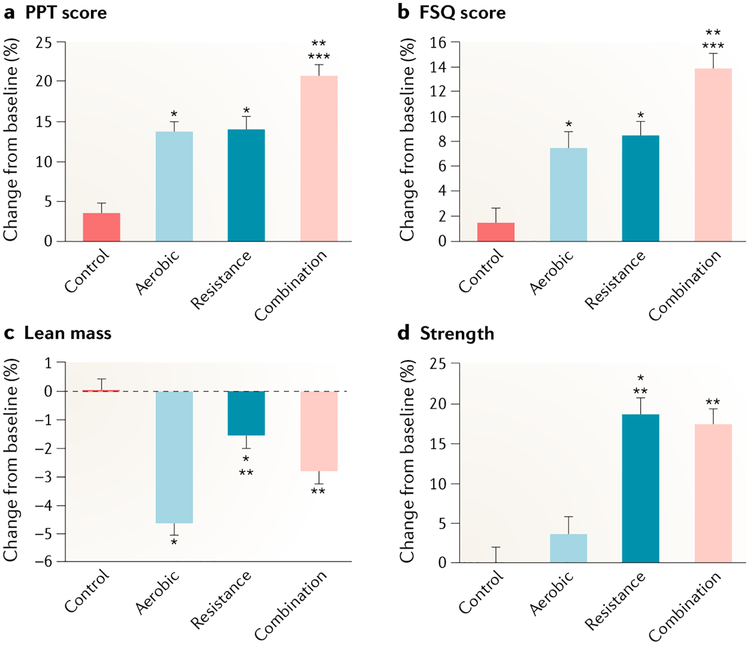
Fig. 3 |. Mean percentage changes in physical function and lean mass during the weight loss interventions.
Measures used included a physical performance test (PPT) (scores range from 0 to 36, with higher scores indicating better functional status) (part a); the Functional Status Questionnaire (FSQ) (scores range from 0 to 36, with higher scores indicating better functional status) (part b); lean mass (part c); and strength (measured as total one repetition maximum (that is, the total of the maximum weight a participant can lift, in one attempt, in the bicep curl, bench press, seated row, knee extension, knee flexion and leg press)) (part d). Scores on the PPT were used as an objective measure of frailty (primary outcome), and scores on the FSQ were used as a subjective measure of frailty. Percentage changes are presented as least-squares-adjusted means; T bars indicate standard errors. *P < 0.05 for the comparison with the control group. **P < 0.05 for the comparison with the aerobic group. ***P < 0.05 for the comparison with the resistance group. Figure adapted with permission from REF247, New England Journal of Medicine, Villareal, D. T. et al. Aerobic or resistance exercise, or both in dieting obese older adults, 376, 1943–1955 Copyright © (2017) Massachusetts Medical Society. Reprinted with permission.

