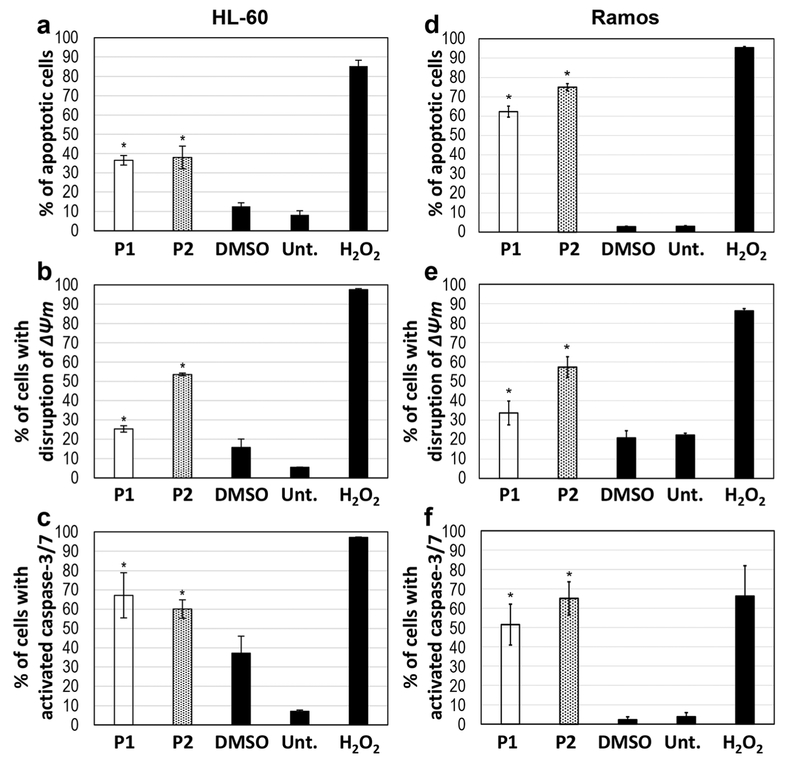
Fig. 2.
P1 and P2 induce cell death via apoptosis. HL-60 cells were treated with 2 μM of either compound (a, b, c), whereas Ramos cells were treated with 2 μM (d) and 4 μM (e, f) of each compound, respectively. (a, d) Annexin V-FITC/PI assay to detect phosphatidylserine exposure after treatment of the cells with P1 and P2 for 24 h. (b, e) Mitochondrial depolarization detected by JC-1 assay after treatment of the cells with P1 and P2 for 5 h. (c, f) Caspase-3/7 activation detected after treatment of the cells with P1 and P2 for 7 h. Time-points were determined based on the occurrence of each event during the time course of apoptosis. The following controls were included in each experiment: DMSO as a vehicle control, H2O2 as a positive (apoptosis-inducing) control and untreated (Unt.) cells as a negative control. The experiments were conducted in triplicate for determination of statistical significance and standard deviation from the mean. Student’s t-test was used to calculate p-values (*indicates a p-value < 0.05)

