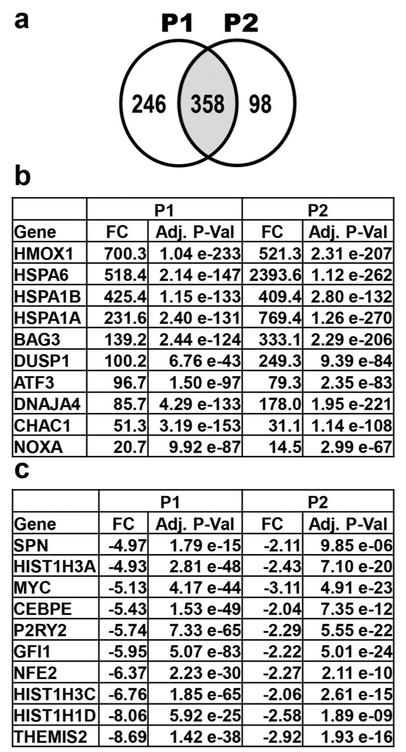
Fig. 3.
Transcriptome analysis after treatment of HL-60 cells with P1 and P2 for 6 h reveals many affected genes. (a) 358 genes similarly affected (genes in common in the overlapping circles; shaded middle portion) by P1 and P2 treatment. P1 and P2 treatment resulted in the up- and down-regulation of 246 and 98 genes, respectively. Genes chosen for analysis were differentially regulated by > 2-fold compared to solvent (0.3% v/v PEG-400) treated cells. (b) Genes up-regulated after both P1 and P2 treatment. The top eight up-regulated genes by both compounds are known to play a role in the unfolded protein response (UPR). The proapoptotic genes CHAC1 and PMAIP1 are also important contributors to the UPR. (c) Ten most down-regulated genes in the transcriptome data of P1 treated cells and corresponding values of P2 treated cells. The fold change (FC) differences and adjusted p-values (Adj. P-Val) are deduced from vehicle control and compound treated samples

