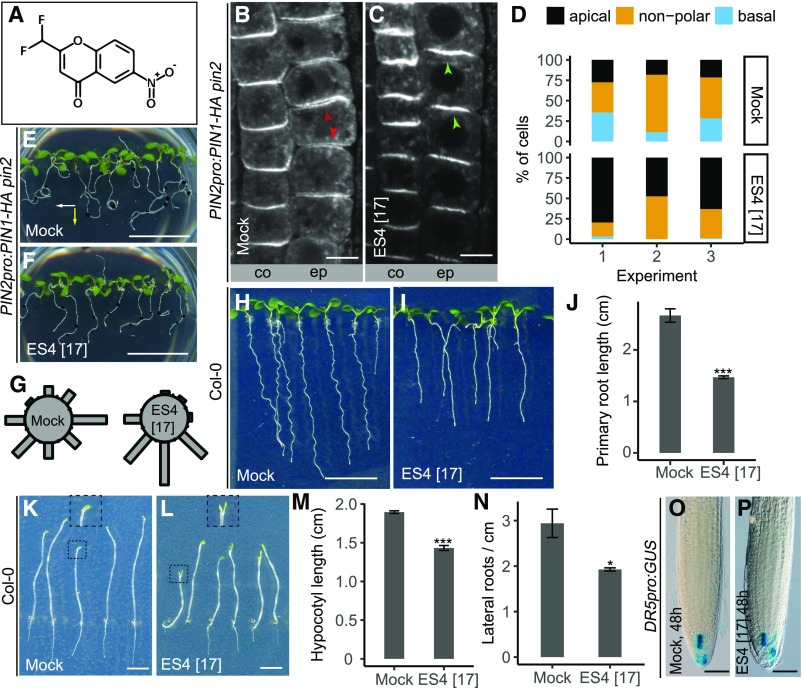
Figure 1.
Identification of ES4.
(A) Chemical structure of ES4.
(B) to (D) Immunolocalization of PIN1-HA in epidermal (ep) and cortex (co) cells in root elongation zones of PIN2pro:PIN1-HA pin2 line in 5-d-old seedlings treated for 48 h with mock or 17 µM ES4. Red arrowheads in (B) indicate basal or nonpolar localization, whereas green arrowheads in (C) indicate apical localization of PIN1-HA in epidermal cells. In each of the three experiments, 4 to 22 roots were analyzed per treatment, per line (in total, 34 roots for mock and 31 roots for ES4 treatments). The number of epidermal cells with apical, nonpolar, or basal PIN1-HA localization from each root has been summed up and represented as a percentage of the total number of cells (D). Bars = 10 µm.
(E) to (G) Gravitropic response of 7-d-old PIN2pro:PIN1-HA pin2 seedlings grown on medium supplemented with mock or 17 µM ES4 and gravistimulated for 48 h. The white and yellow arrows mark gravity vectors after the first and second gravistimulation, respectively. Black dots on the roots indicate the localization of the root tips at the time of plate turning. In contrast to mock (E), PIN2pro:PIN1-HA pin2 grown on 17 µM ES4 (F) shows a positive gravitropic response. Gravistimulated roots were assigned into one of the eight 45° sectors on the gravitropism diagram (G). The length of bars in the diagram represents the percentage of pooled number of seedlings from four independent experiments assigned to a respective sector. In each experiment, 7 to 16 roots per treatment were analyzed (in total, 43 roots for mock and 41 roots for ES4 treatments). Bars = 1 cm.
(H) to (J) Root length of 7-d-old Col-0 seedlings grown on medium supplemented with mock or 17 µM ES4. Values represent means ± se of three independent experiments (J), each consisting of 13 to 22 analyzed roots per treatment (in total, 48 roots per treatment). Asterisks indicate significant difference between mock and ES4 treatment (two-tailed Student’s t test, ***P < 0.001). Bars = 1 cm.
(K) to (M) Hypocotyl length of 7-d-old Col-0 seedlings grown in the dark on medium supplemented with mock or 17 µM ES4. Insets represent magnified cotyledons. Values represent means ± se of three independent experiments (M), each consisting of 20 to 30 analyzed roots per treatment. Asterisks indicate significant difference between mock and ES4 treatment (two-tailed Student’s t test, ***P < 0.001). Bars = 0.5 cm.
(N) Quantification of lateral roots density in 11-d-old Col-0 seedlings grown on medium supplemented with mock or 17 µM ES4. Values represent means ± se of three independent experiments, each consisting of at least 20 analyzed roots per treatment. Asterisks indicate significant difference between mock and ES4 treatment (two-tailed Student’s t test, *P < 0.05).
(O) and (P) GUS staining of 5-d-old DR5pro:GUS seedlings. Three-day-old seedlings were transferred to growth medium supplemented with mock (O) or 17 µM ES4 (P) and grown for 48 h. In two independent experiments, 7 to 12 roots per treatment were analyzed. Bars = 100 µm.

