Figure 2.
Effect of ES4 on Intracellular Trafficking.
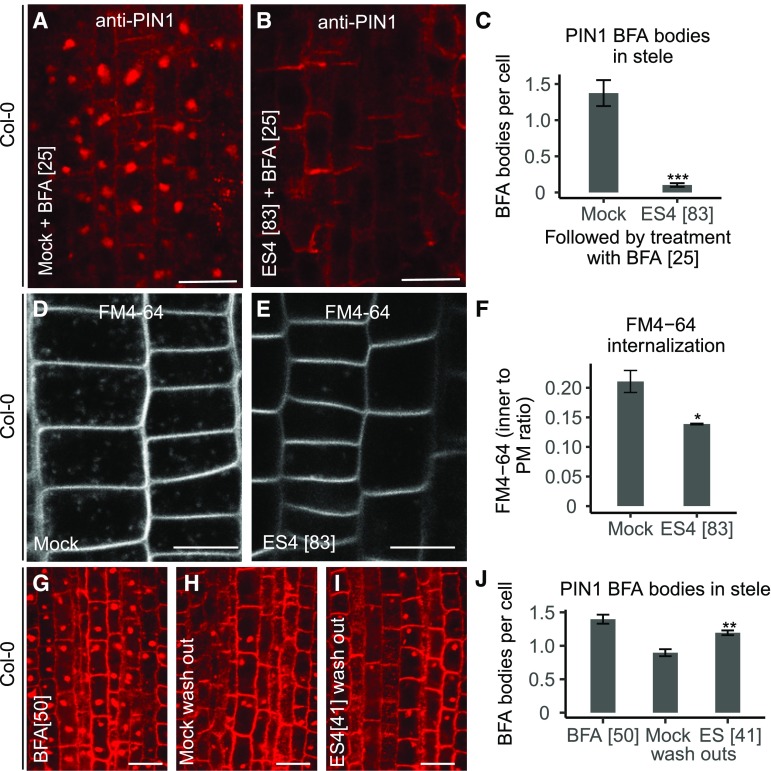
(A) to (C) Immunolocalization of PIN1 (red signal) in Col-0 stele cells ([A] and [B]) and mean number of BFA bodies per cell (C). Five-day-old seedlings were pretreated for 30 min with mock or 83 µM ES4 before 25 µM BFA was added for an additional 90 min. Values represent means ± se of four independent experiments, each consisting of 4 to 17 analyzed roots per treatment (in total, 41 roots per treatment) (C). The number of BFA bodies was counted for 10 cells in the stele of each root. Asterisks indicate significant difference between mock and ES4 treatment (two-tailed Mann-Whitney U test, ***P < 0.001). Bars = 10 µm.
(D) to (F) Uptake of endocytic tracer FM4-64 (2 µM) after 10 min. Five-day-old Col-0 seedlings were pretreated for 2 h with mock (D) or 83 µM ES4 (E). FM4-64 uptake was quantified by dividing the mean gray value of the fluorescent signal inside the cell to the adjacent PM signal (F). Values represent means ± se of three independent experiments, each consisting of 5 to 11 analyzed roots per treatment. Asterisks indicate significant difference between mock and ES4 treatment (two-tailed Student’s t test, *P < 0.05). Bars = 10 µm.
(G) to (J) Immunolocalization of PIN1 (red signal) in the stele ([G] to [I]) and number of BFA bodies per cell after washout with ES4 (J). Five-day-old seedlings were treated for 2 h with 50 µM BFA (G), followed by 30 min of washout with medium complemented with mock (H) or 41 µM ES4 (I). Values represent means ± se of three independent experiments (J), each consisting of 4 to 11 analyzed roots per treatment (in total, 16 to 23 roots per treatment). The number of BFA bodies was counted for 5 to 49 cells in the stele of each root. Asterisks indicate significant difference between mock and ES4 washout (two-tailed Mann-Whitney U test, **P < 0.01). Bars = 10 µm.

