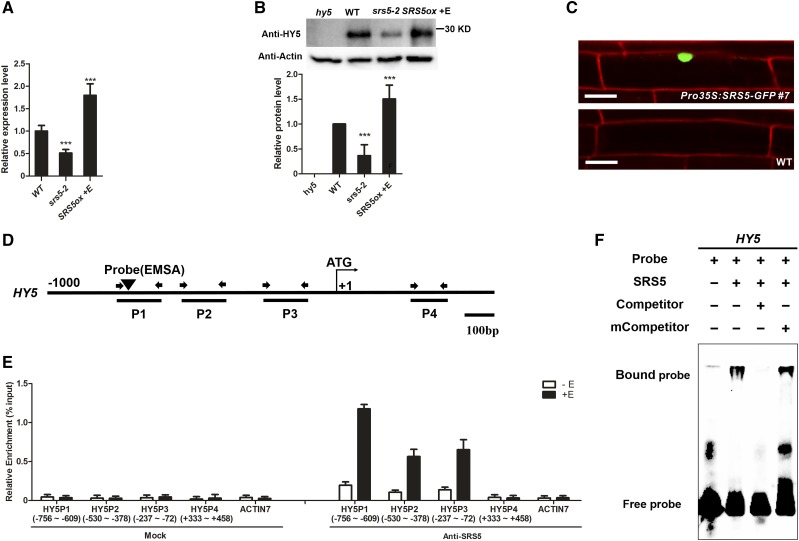
Figure 3.
SRS5 Activates HY5 Expression by Directly Binding to Its Promoter.
(A) HY5 expression as measured by RT-qPCR in wild-type, srs5-2, and estradiol-treated SRS5ox seedlings grown under white light. Expression levels were normalized against that in wild-type seedlings, which was set to 1. Data are means ± sd of three independent biological replicates. Asterisks indicate significant difference at ***P < 0.001 (Student’s t test; Supplemental File 1).
(B) Immunodetection of HY5 in wild type, srs5-2, and estradiol-treated SRS5ox seedlings grown under white light (top). Relative HY5 band intensities of the immunoblot analysis (bottom panel). HY5 protein level in wild-type seedlings was set to 1. The error bars indicate the sd from triplicate experiments. Asterisks indicate significant difference at ***P < 0.001 (Student’s t test; Supplemental File 1).
(C) Nuclear localization of SRS5-GFP. The wild-type and Pro35S:SRS5-GFP seedlings were stained with propidium iodide. Fluorescence microscopy images show SRS5-GFP fusion protein in the nucleus in Pro35S:SRS5-GFP plants. Bar = 20 µm.
(D) Schematic diagram of the DNA fragments used for ChIP and the probes used for EMSA. The sequences 1 kb upstream of the start sites and parts of the coding sequences of HY5 are shown. The translational start site (ATG) is shown at position +1.
(E) Enrichment of the indicated DNA fragments following ChIP using anti-SRS5 antibodies. Chromatin from estradiol-treated or nontreated SRS5ox plants was immunoprecipitated using anti-SRS5 antibodies, and the presence of the indicated DNA in the immune complex was determined by RT-qPCR. The numbers of the analyzed DNA fragments indicate the positions relative to the translation start site (referred to as position +1). The ACTIN7 promoter fragment was used as a negative control. The ChIP values were normalized to their respective DNA inputs. The experiments were repeated three times with similar results. Data shown are representative of three independent experiments. Error bars indicate se of three technical replicates.
(F) EMSA of SRS5 binding to HY5 in vitro. Biotin-labeled probes were incubated with SRS5, and free and bound DNAs were separated in an acrylamide gel. As indicated, unlabeled probes were used as competitors.

