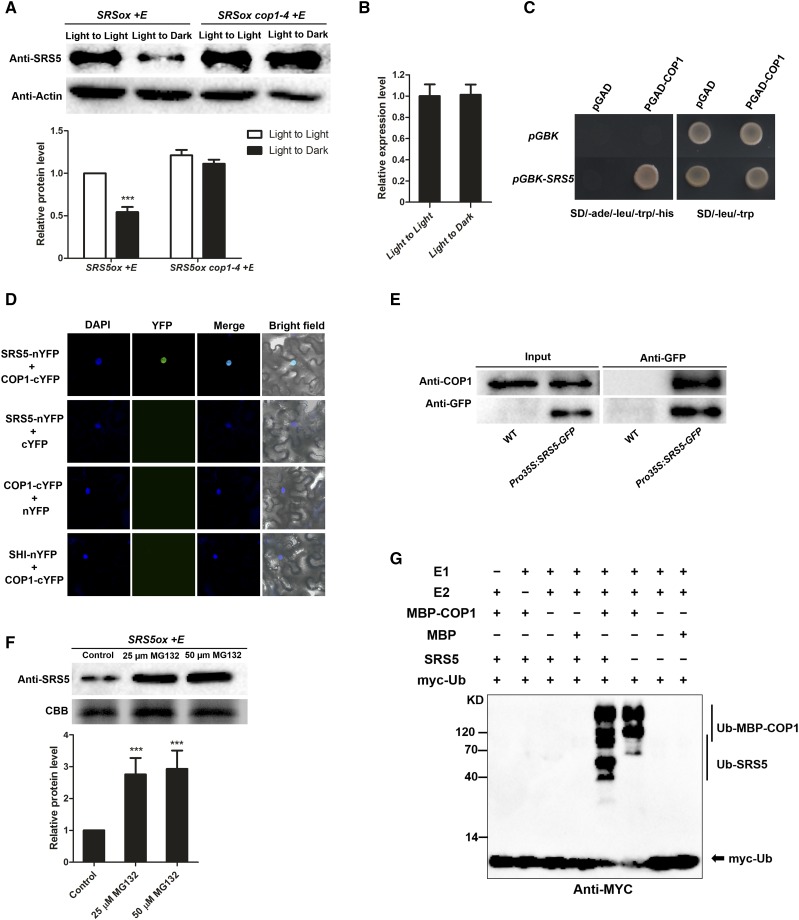
Figure 5.
SRS5 Abundance Is Controlled by COP1-Mediated Degradation.
(A) Immunodetection of SRS5 in estradiol-treated SRS5ox and SRS5ox cop1-4 seedlings which were grown under white light for 5 d and then transferred to darkness for 12 h compared with that in the seedlings under continuous white light (top). Anti-actin served as a loading control. Relative SRS5 band intensities of the immunoblot analysis (bottom panel). SRS5 protein level in estradiol-treated SRS5ox under continuous light was set to 1. The error bars indicate the sd from triplicate experiments. Asterisks indicate significant difference at ***P < 0.001 (Student’s t test; Supplemental File 1).
(B) SRS5 expression assayed by RT-qPCR in estradiol-treated SRS5ox after dark treatment for 12 h compared with that in seedlings under continuous light. Expression levels were normalized against that in seedlings under continuous light, which was set to 1. Data are means ± sd of three independent biological replicates.
(C) Yeast two-hybrid interaction assay showing the interaction of SRS5 and COP1.
(D) BiFC assay showing the interaction of SRS5 and COP1 in N. benthamiana leaves. Coexpressing SHI-nYFP and COP1-cYFP and unfused YFP C-terminal (cYFP) or N -terminal (nYFP) fragments served as negative controls, as indicated. DAPI staining marked nuclei. Merge: Merged images of YFP channel and DAPI.
(E) Co-IP analysis showing that SRS5 interacts with COP1 in vivo. Wild-type and Pro35S:SRS5-GFP seedlings were used in a co-IP assay using anti-GFP antibodies, and the immunoprecipitated proteins were analyzed by immunoblot using anti-COP1 and anti-GFP, respectively.
(F) Immunodetection of SRS5 abundance in estradiol-treated SRS5ox seedlings in the presence of various concentrations of MG132 (25 or 50 μM) for 3 h (top). Relative SRS5 band intensities of the immunoblot analysis (bottom panel). SRS5 protein level in estradiol-treated SRS5ox without MG132 treatment was set to 1. The error bars indicate the sd from triplicate experiments. Asterisks indicate significant difference at ***P < 0.001 (Student’s t test; Supplemental File 1).
(G) COP1 ubiquitinates SRS5 in vitro. In vitro ubiquitination assays were performed in a reaction mix containing UBE1 (E1), UbcH5b (E2), and myc-tagged ubiquitin (myc-Ub). Ubiquitinated MBP-COP1 and SRS5 were detected by anti-myc. The “+” and “−” indicate presence and absence, respectively.

