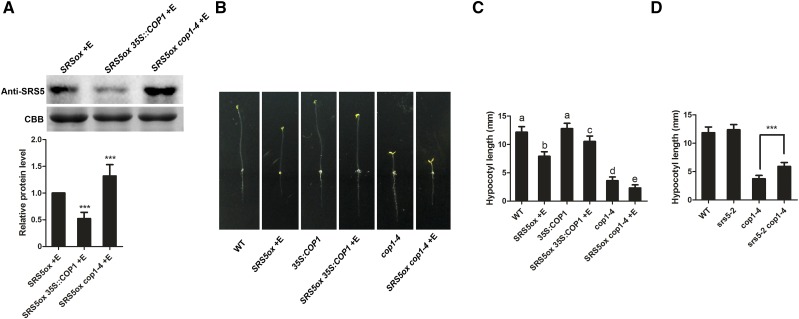
Figure 6.
COP1 Controls SRS5 Abundance in Plant Photomorphogenesis.
(A) Immunodetection of SRS5 in estradiol-treated SRS5ox, 35S:COP1 SRS5ox and cop1-4 SRS5ox grown in darkness (top). Relative SRS5 band intensities of the immunoblot analysis (bottom panel). SRS5 protein level in estradiol-treated SRS5ox was set to 1. The error bars indicate the sd from triplicate experiments. Asterisks indicate significant difference at ***P < 0.001 (Student’s t test; Supplemental File 1).
(B) The dark-grown phenotypes of 5-d-old seedlings of the wild type, estradiol-treated SRS5ox, 35S:COP1, estradiol-treated SRS5ox 35S:COP1, cop1-4, and estradiol-treated SRS5ox cop1-4.
(C) Quantitation of hypocotyl lengths in seedlings from (B). Data are means ± sd; n ≥ 30. Different letters indicate significant differences between the annotated columns (P < 0.05 by Tukey’s test).
(D) Hypocotyl lengths of wild-type, srs5-2, cop1-4, and srs5-2 cop1-4 seedlings grown in the dark. Data are means ± sd; n ≥ 30. Asterisks indicate significant differences between cop1-4 and srs5-2 cop1-4 (Student’s t test; Supplemental File 1). ***P < 0.001.

