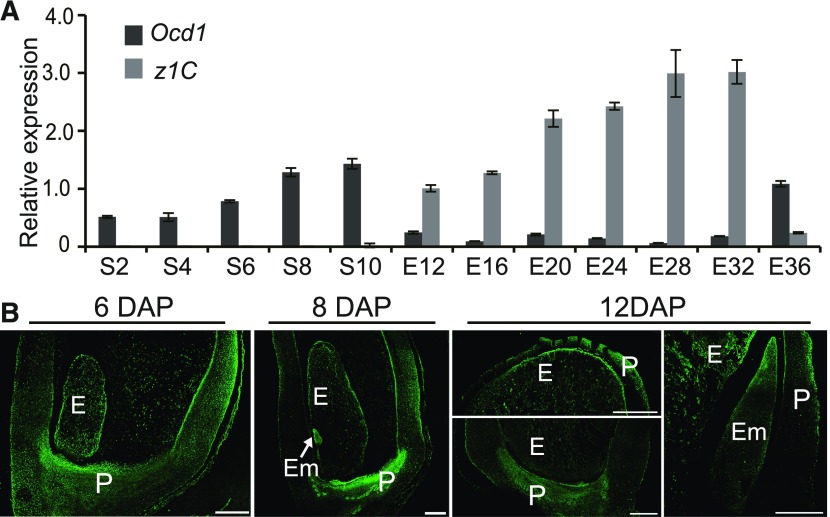
Figure 4.
The Transcript and Protein Expression Pattern of Ocd1 during Seed Development.
(A) RT-qPCR analysis of Ocd1 expression during seed development. z1C was used as an endosperm-specific marker. All expression levels are normalized to that of Ubi. Three replicates for each RNA sample were made and error bars represent ±sd.
(B) Immunofluorescent assay of the OCD1 distribution during seed development.
E, endosperm; Em, embryo; P, pericarp, S, seed. Bars = 500 μm.

