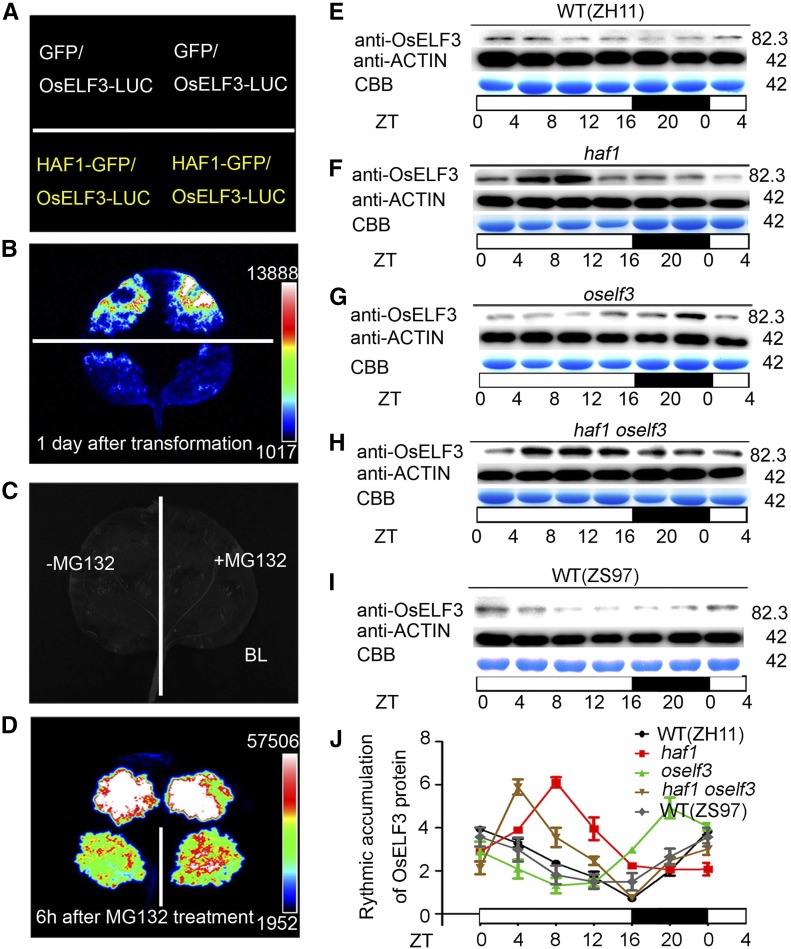
Figure 4.
In Vivo Ubiquitination Assays Showing the Degradation of OsELF3 by HAF1.
(A) to (D) Relative luciferase activity in wild tobacco leaves coinfiltrated by OsELF3-LUC and HAF1-GFP. GFP was used as a negative control. (A) and (C) show the setup used in (B) and (D), respectively. MG132 inhibits the degradation of OsELF3-LUC by HAF1-GFP. Black represents the weakest luciferase activity, and white represents the strongest luciferase activity.
(E) to (I) Time-course analysis showing rhythmic accumulation of OsELF3 in ZH11 (E), haf1 (F), oself3 (G), haf1 oself3 (H), and ZS97 (I) plants under LD conditions. OsELF3 was detected with anti-OsELF3 antibody. CBB, Coomassie Brilliant Blue staining. Molecular masses of OsELF3 and ACTIN proteins in kilodaltons are indicated on the right. White and black bars represent subjective days and nights, respectively. ZT, Zeitgeber time. ZT = 0 is defined as the time of lights on; numbers represent hours after ZT0 that the sample was harvested.
(J) The relative abundance (rhythmic accumulation) of OsELF3 protein in wild-type (ZH11), haf1, oself3, haf1 oself3, and wild-type (ZS97) plants. Mean and sd (error bars) values were obtained from three biological repeats (each protein sample was obtained from three separate plants).

