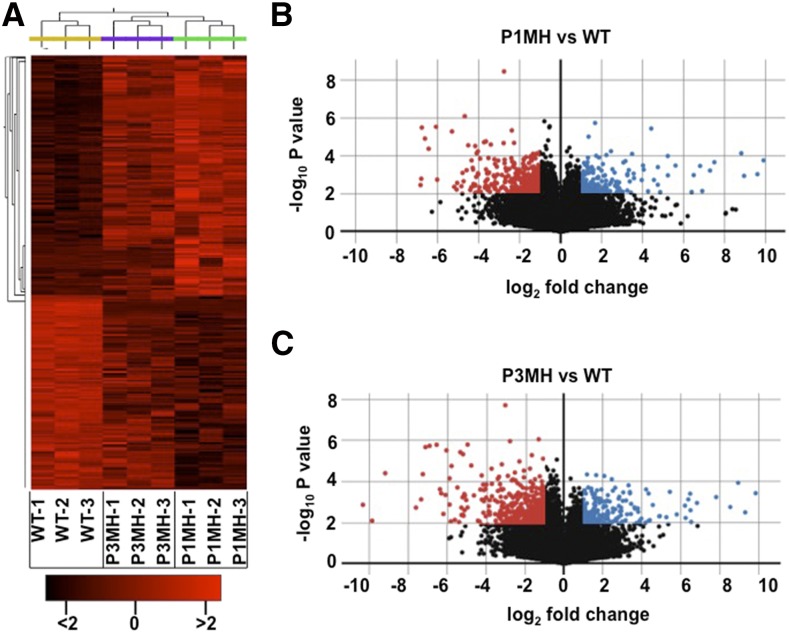
Figure 10.
Gene Expression Profile Presented as a Clustered Heat Map and Volcano Plot.
(A) Clustered heat map showing the genotype grouping of wild type and RBP-P mutants, P1MH and P3MH.
(B) and (C) Volcano plots of differentially expressed genes in P1MH (B) and P3MH (C) compared with the wild type. The horizontal lines represent log2 fold changes, and the vertical lines represent P value (−log10). Differentially expressed genes were defined as having a log2 fold change of >1 and a P value of <0.01 (−log10 > 2). Upregulated and downregulated genes are represented by blue and red dots, respectively.

