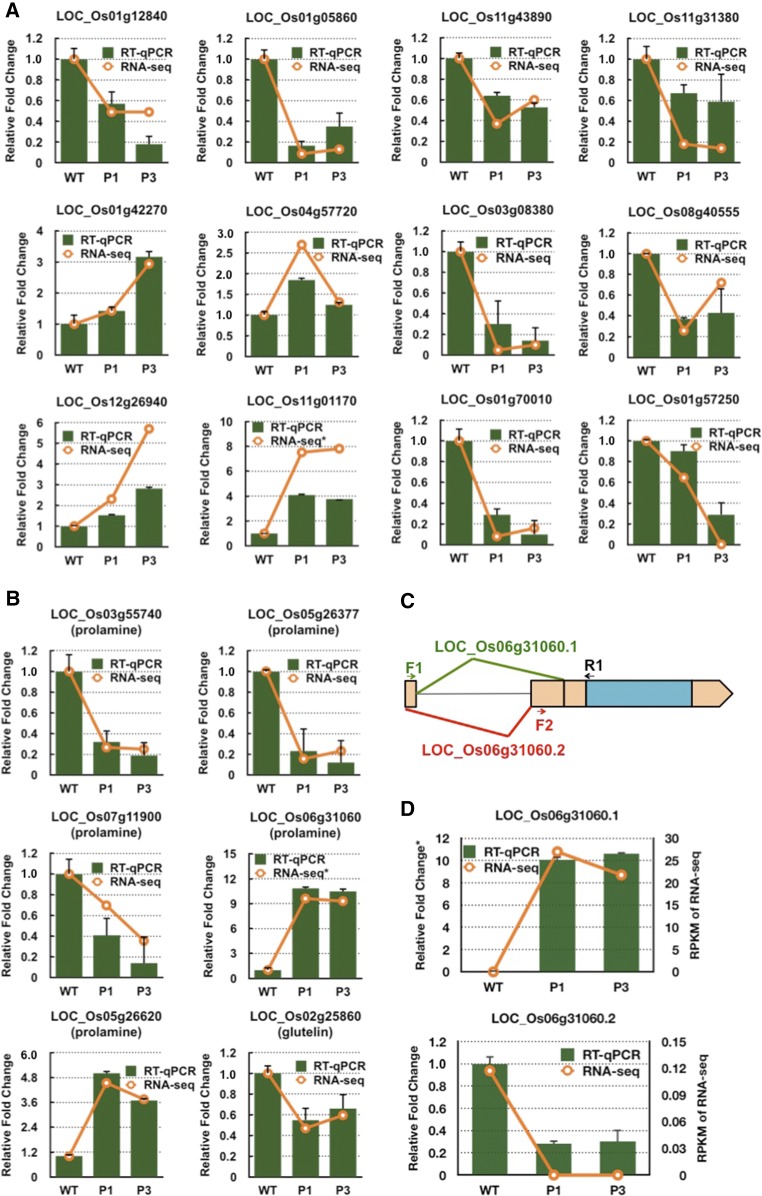
Figure 12.
RT-qPCR Validation of Differentially Expressed Genes and Expression of Storage Proteins in Rice Grains.
(A) and (B) Expression levels of selected genes differentially expressed in P1MH and P3MH. Green columns indicate the results of RT-qPCR, and orange lines show the data from RNA-seq. y axis, fold change relative to that of the wild type. The relative fold changes in the RNA-seq data for LOC_01g01170 and LOC_Os06g31060 panels are based on log2 fold changes.
(C) Schematic representation of the two splicing forms of the prolamine gene, LOC_Os06g31060. The location of the intron is denoted by a thin black line. The two exons involved in alternative splicing are highlighted in orange blocks. F1, F2, and R1 show the location of the designed primers for detection of the two splicing forms.
(D) RT-qPCR to detect the relative expression of LOC_Os06g31060.1 and LOC_Os06g31060.2 compared with the wild type. Right y axis indicates the RPKM data from RNA-seq. Relative fold change in the LOC_Os06g31060.1 panel is based on a log2 fold change. The error bars in (A), (B), and (D) represent the se of the mean from three technical repeats of RT-qPCR.

