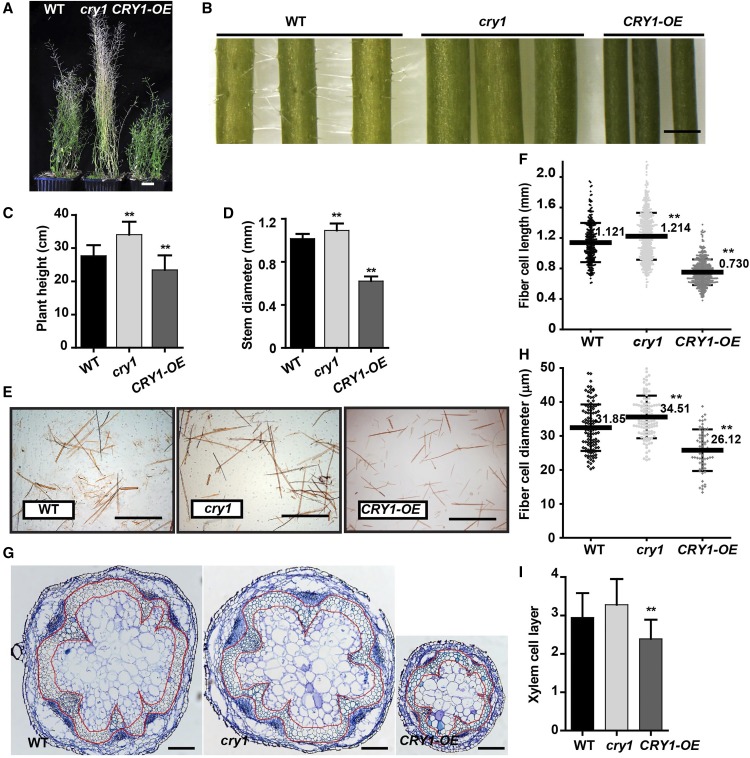
Figure 1.
CRY1 Affects Elongation and Morphology of the Fiber Cells in Inflorescence Stems.
(A) Growth phenotypes of Arabidopsis plants after 10 weeks of growth in white light. Bar = 2 cm.
(B) Inflorescence stem (lower part). Bar = 1 mm.
(C) Heights of cry1, CRY1 overexpression (CRY1-OE), and wild type (WT) plants. More than 20 plants per genotype were analyzed.
(D) Inflorescence stem diameter. More than 20 plants per genotype were analyzed. Student’s t test (**P < 0.01) was used for statistical analyses; mean ± sd.
(E) Disaggregated fiber cells in (B) stained with Safranin T. Bar =1 mm.
(F) Fiber cell length. More than 500 fiber cells were measured in each sample and three biological replicates were performed. Student’s t test (**P < 0.01) was used for statistical analyses; mean ± sd.
(G) Stem cross-sections stained with toluidine blue. Interfascicular fiber and xylem cells are shown within the area enclosed in the red markings. Bar = 200 μm.
(H) Fiber cell diameter. About 100 fiber cells were measured in each sample and three biological replicates were performed. Student’s t test (**P < 0.01) was used for statistical analyses; mean ± sd.
(I) Layers of xylem cells in (G). Three biological replicates and more than 15 samples (n ≥ 15) from each genotype were analyzed. Student’s t test (**P < 0.01) was used for statistical analyses; mean ± sd.

