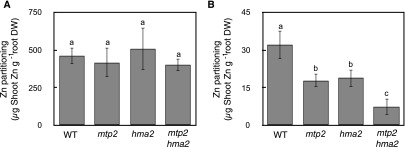
Figure 7.
Genetic Interaction between mtp2 and hma2.
Shoot Zn concentrations in 19-d-old wild-type, mtp2, hma2, and mtp2 hma2 seedlings grown on control (A) and Zn-deficient medium (B). Bar graphs show arithmetic means ± sd (n = 4 plates, each with 16 to 18 seedlings). Distinct letters indicate significant differences (P < 0.05) according to a Bonferroni-corrected Student’s t test.

