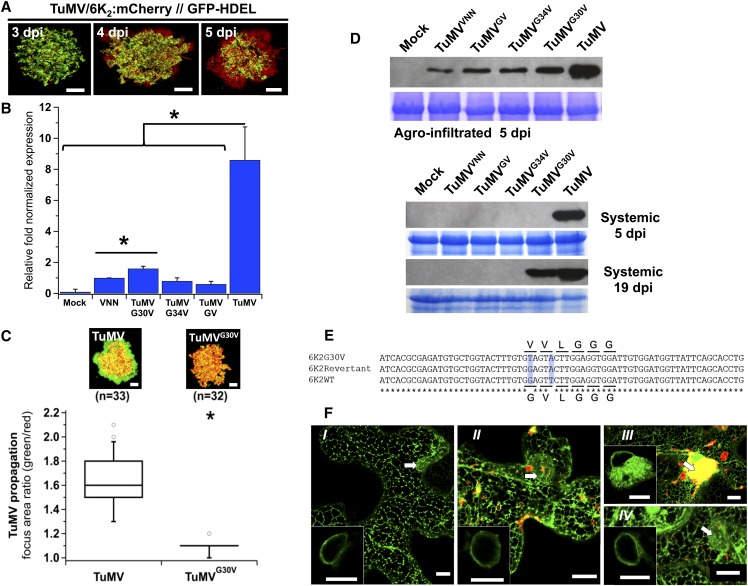
Figure 3.
The GxxxG Motif Is Important for Virus Replication.
(A) Time course of TuMV intercellular movement in N. benthamiana after agroinfiltration of pCambiaTuMV/6K2:mCherry//GFP-HDEL.
(B) Viral replication evaluated by RT-qPCR from N. benthamiana leaves agroinfiltrated with pCambia (Mock) and the pCambiaTuMV mutants indicated at 3.25 dpi. Values are graphically presented on a histogram. Statistical differences were determined by t test analyses (*P < 0.05). Error bars depict the sd calculated from values obtained in the three biological replicates.
(C) TuMV/6K2:GFP (TuMV) or TuMVG30V/6K2G30V:GFP (TuMVG30V) was coagroinfiltrated with mCherry-HDEL and expression of GFP and mCherry fusions is shown at 5 dpi. Upper panels are representative images of infection foci corresponding to the median value of each treatment. Data sets for TuMV and TuMVG30V treatments are graphically presented below as whisker and box plots. Statistical significant differences (*P < 0.05). n, number of infection foci analyzed.
(D) Total proteins from pCambia- (Mock), pCambiaTuMVVNN-, pCambiaTuMVGV-, pCambiaTuMVG34V-, pCambiaTuMVG30V-, and pCambiaTuMV-agroinfiltrated leaf tissues at 5 dpi, agroinfiltrated leaf tissues, and upper nonagroinfiltrated (systemic) leaf tissues at 5 and 19 dpi were analyzed by immunoblot with a rabbit serum against TuMV CP. Coomassie blue staining (bottom panel of agroinfiltrated 5 dpi, systemic 5 dpi and 19 dpi) shows equal protein loading.
(E) An alignment ofnucleotide sequence of 6K2, 6K2G30V, and its related revertant is shown. Asterisks indicate the conserved nucleotides and the differences are shadowed in light blue. The amino acid residues encoded by the underlined nucleotides are shown.
(F) Confocal microscopy observation of N. benthamiana epidermal leaf cells expressing the ER marker GFP:HDEL alone (I) or with pCambiaTuMVVNN/6K2:mCherry (II), pCambiaTuMV/6K2:mCherry (III), or pCambiaTuMVG30V/6K2G30V:mCherry (IV). Images are three-dimensional renderings of 40 1-μm-thick slices that overlap by 0.5 μm. Arrows denote the position of the nucleus and bottom left inserts are single optical slices of the area denoted by the arrow showing the ER surrounding the nucleus.
Three independent biological repeats were performed for (A) to (C) and (F), and two for (D) with the exception that reversion of TuMVG30V was noted once. Bars = 20 μm in (A) and (C) and 10 μm in (F).

