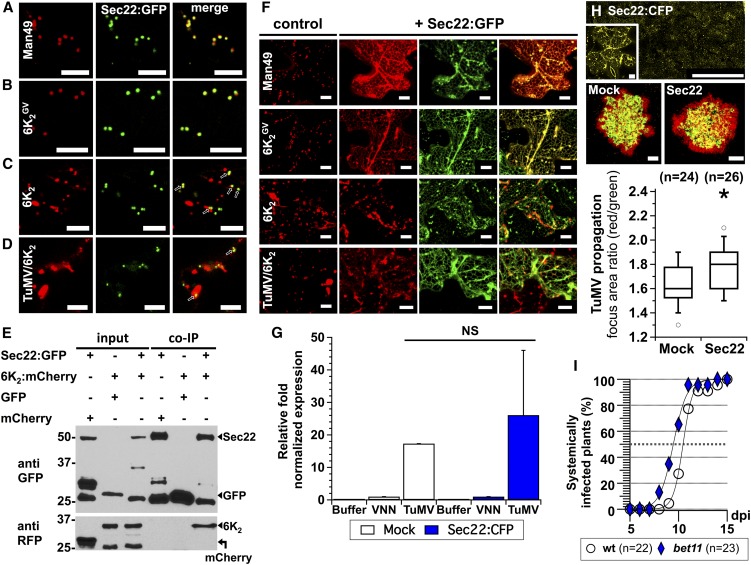
Figure 4.
Impairing the Fusion of Transport Vesicles with the Golgi Apparatus Enhances TuMV Intercellular Movement.
(A) to (D) Confocal microscopy observation of N. benthamiana epidermal leaf cells coexpressing Sec22:GFP (middle panels) along with the Golgi marker Man49:mCherry ([A], left panel, 6K2GV:mCherry ([B], left panel), 6K2:mCherry ([C], left panel), or 6K2:mCherry during TuMV infection ([D], left panel). Coexpression is shown in the right panels (merge), and colocalization is indicated with arrows in (C) and (D). Confocal images are single optical images 1 μm thick.
(E) Immunoblots of immunopurifications performed from different protein expression combinations (upper table and indicated by arrows) of mCherry with Sec22:GFP, 6K2:mCherry with GFP, or 6K2:mCherry with Sec22:GFP in N. benthamiana leaves. Intermediate bands are degradation byproducts or nonspecific proteins recognized by the polyclonal GFP antiserum.
(F) Confocal microscopy of N. benthamiana epidermal leaf cells expressing the Golgi marker Man49:mCherry, 6K2GV:mCherry, or 6K2:mCherry ectopically or 6K2:mCherry during TuMV infection, alone (control panels) or in cells overexpressing Sec22 (+Sec22:GFP, left panels show Man49:mCherry, 6K2GV:mCherry or 6K2:mCherry ectopically or 6K2:mCherry during TuMV expression in red, middle panels show Sec22:GFP overexpression in green, and right panels show merged signals). Images are three-dimensional renderings of 40 1-μm-thick slices that overlap by 0.5 μm.
(G) Viral replication was evaluated by RT-qPCR at 3.25 dpi from N. benthamiana agroinfiltrated with pCambia (Buffer), pCambiaTuMVVNN (VNN), or pCambiaTuMV (TuMV) 1 d after infiltration with pCambia (Mock, white) or pCambiaSec22:CFP (blue). Error bars show the sd calculated from values obtained in the three biological replicates.
(H) Sec22:CFP was transiently expressed one day before TuMV/6K2:mCherry//GFP-HDEL inoculation, and expression of GFP and mCherry fusions was acquired at 5 dpi. Panels are representative images of infection foci corresponding to the median value of each treatment. Data sets for Mock and Sec22-overexpressed treatments are graphically presented as whisker and box plots. Statistical significance was tested with the nonparametric Wilcoxon-Mann-Whitney two sample rank test (*P < 0.05). n represents the number of infection foci analyzed.
(I) Time course of TuMV systemic infection of wild-type Arabidopsis plants (circles) and bet11 KO mutant plants (diamonds) after pCambiaTuMV/6K2:GFP agroinfiltration. Infection is scored by appearance of systemic GFP fluorescence.
Two independent biological repeats were performed for (A) to (D), and three for (E) to (I). Bars = 10 μm in (A) to (D) and (F), 1 mm in (H), and 10 μm in (H) inset.

