
Figure 1.
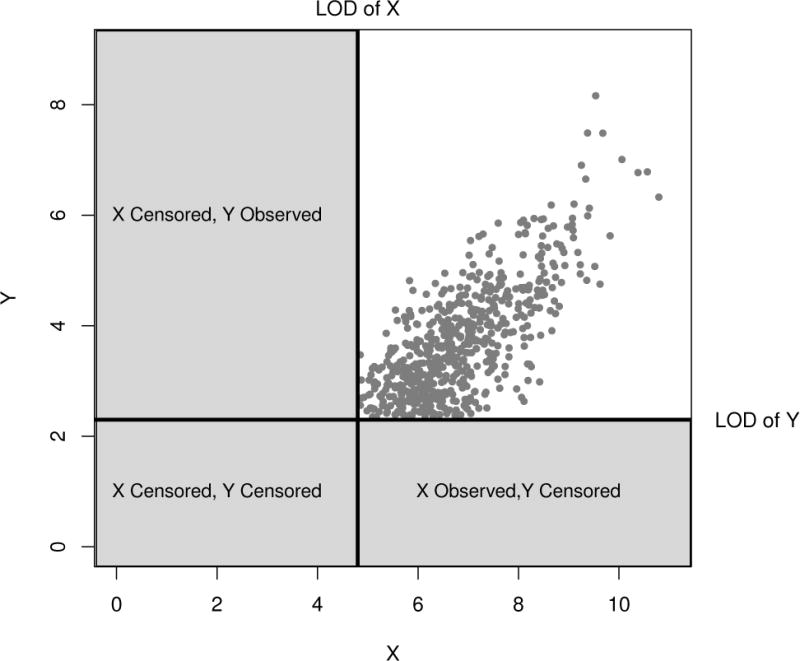
Graphical representation of regression with censoring in both X and Y. This graphic demonstrates that knowing the censoring status of both the predictor X and response Y allows us to know the region in which censored data points will be estimated. The locations where points will be estimated are important because it will influence the slope and intercept of the regression line.