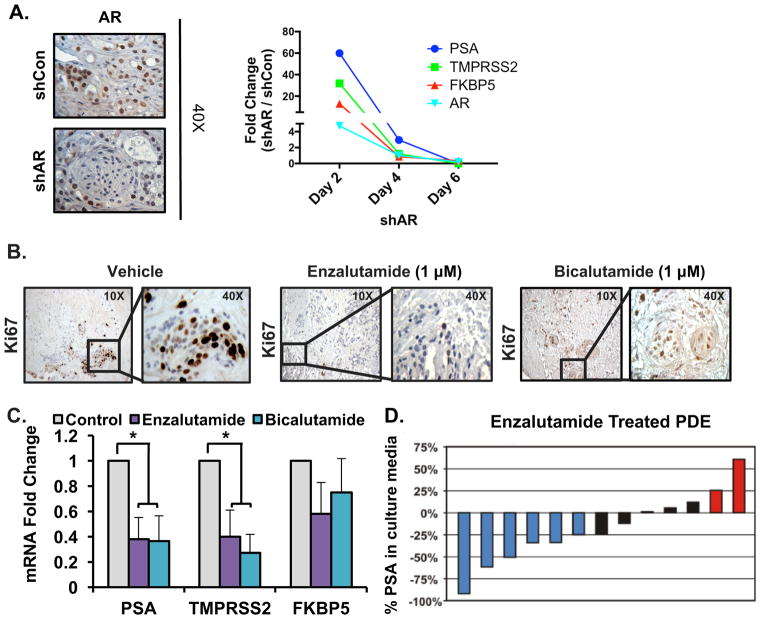
Figure 3. AR signaling can be perturbed both genetically and pharmacologically in the PDE model.
A. Knockdown of AR was achieved through lentirviral transduction of PDE with an AR directed shRNA for 6 days. Representative images show AR and Ki67 IHC for shCon and shAR after 6 days. Right: Expression of AR and AR target genes (PSA, FKBP5, and TMPRSS2) mRNA expression from tumor samples treated with shCon and shAR for 2, 4, and 6 days, n=3. B. Representative images (10X and 40X magnification) are shown for vehicle, AR antagonist (1 μM Enzalutamide), and AR antagonist (1 μM Bicalutamide) treated tumors after 6 days of treatment, n=3. C. Expression of AR target genes (PSA, TMPRSS2, and FKBP5) mRNA expression from vehicle, 1 μM Enzalutamide, and 1 μM Bicalutamide treated PDE. Average fold change of three PDE shown. n=3, *p< 0.05. D. Waterfall plot depicting the percentage change of PSA in the culture medium with 1 μM Enzalutamide treatment. Blue bars represent patients with ≥ 25% decrease in PSA, black bars represent no change in PSA, and red bars represent ≥ 25% increase in PSA.

