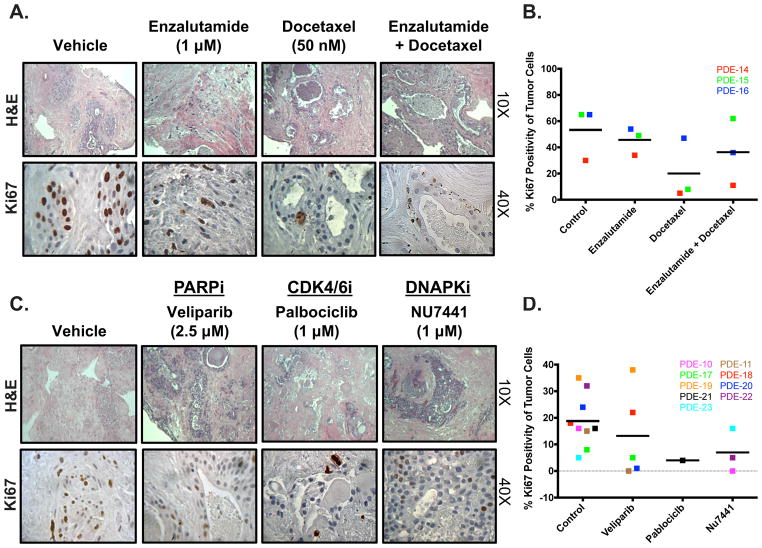
Figure 4. PDE model is responsive to clinically approved and experimental PCa therapeutics.
Tissue was cultured in complete media, treated with different drugs, and harvested after 6 days. Drug treatment was changed out every 48 hours. Ki67 staining was performed to determine the amount of proliferation that occurred in order to evaluate the effect of drug treatment on PDE growth. A. Representative H&E image (10X magnification) and Ki67 image (40X magnification) are shown for vehicle, AR antagonist (1 μM Enzalutamide), Taxane (50 nM Docetaxel), and AR antagonist (Enzalutamide) + Taxane (Docetaxel) treated tumors (PDE-14). B. Quantification of KI67 immunostaining from 3 separate patient samples. Sample depicted in red is the PDE used for images in A. C. Representative H&E image (10X magnification) and Ki67 image (40X magnification) are shown for vehicle, PARP Inhibitor (2.5 μM Veliparib) (PDE-17), CDK4/6 Inhibitor (1 μM Palbociclib) (PDE-21), and DNAPK Inhibitor (1 μM NU7441) (PDE-22). D. Quantification of KI67 immunostaining from 3 separate patient samples. Sample depicted in green (Veliparib), black (Palbociclib), and yellow (NU7441) are the PDE used for images in C.

