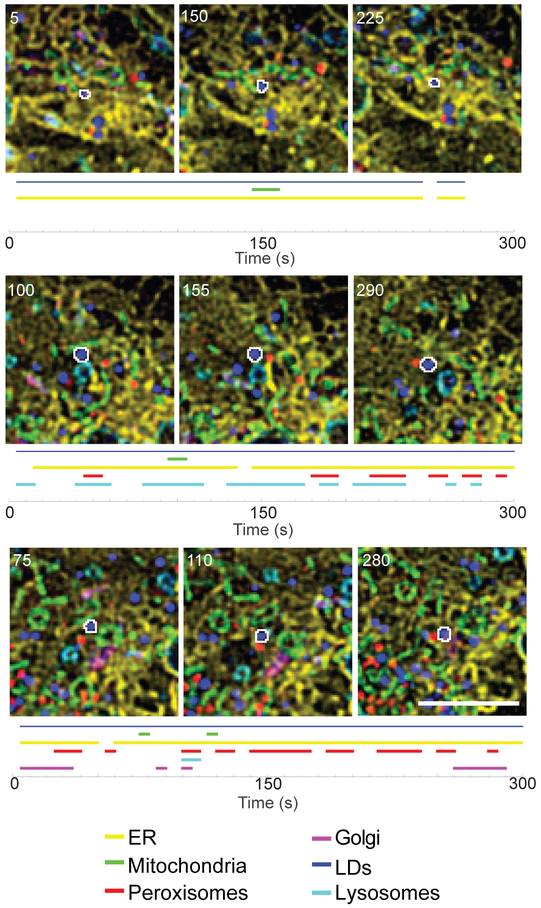
Figure 4: LD-organelle contacts over time.
Micrographs of a COS-7 cell expressing fusion proteins targeted to the ER (yellow), mitochondria (green), Golgi (red), lysosomes (magenta), and peroxisomes (cyan), and labeled with a lipophilic dye to label LDs (blue). The LDs outlined in white were tracked, and their interorganelle contacts mapped over time. A blue line indicates that the LD was successfully tracked, while colored lines indicate that the LD was within 1 pixel (97 nm) of the indicated organelle at the specified time point. Numbers on the micrographs represent time (s). Scale bar, 5 μm. Modified with permission from Valm et al., 2017.

